Check out some of the improvements and additions in the new version of JMeter 5.0
...RECENT BLOG
2020 / 2 / 27

2020 / 2 / 27

2020 / 2 / 27

2020 / 2 / 27

2020 / 2 / 27

Apache JMeter is a powerful tool for Load Testing and Performance Testing. You know what! One of the most exciting features of Apache JMeter is that it is an Open Source Software. Yes! You heard it right. This gives any curious developer an opportunity to develop code to extend JMeter functionality. These additions are known as Plugins.
Plugins aid to extend the functionality of the software. Developers have already created a large variety of plugins.
The JMeter Plugins Website lists all the available plugins. At present, there are 76 plugins available on the website. All you need to do is to search and find a plugin that best suits your needs.
I got top JMeter plugins from JMeter Plugins Website which shows the Usage Statistics according to which Plugins are rated in the order from Most Popular to Least Popular. The website contains more information like Documentation, Support Forum.
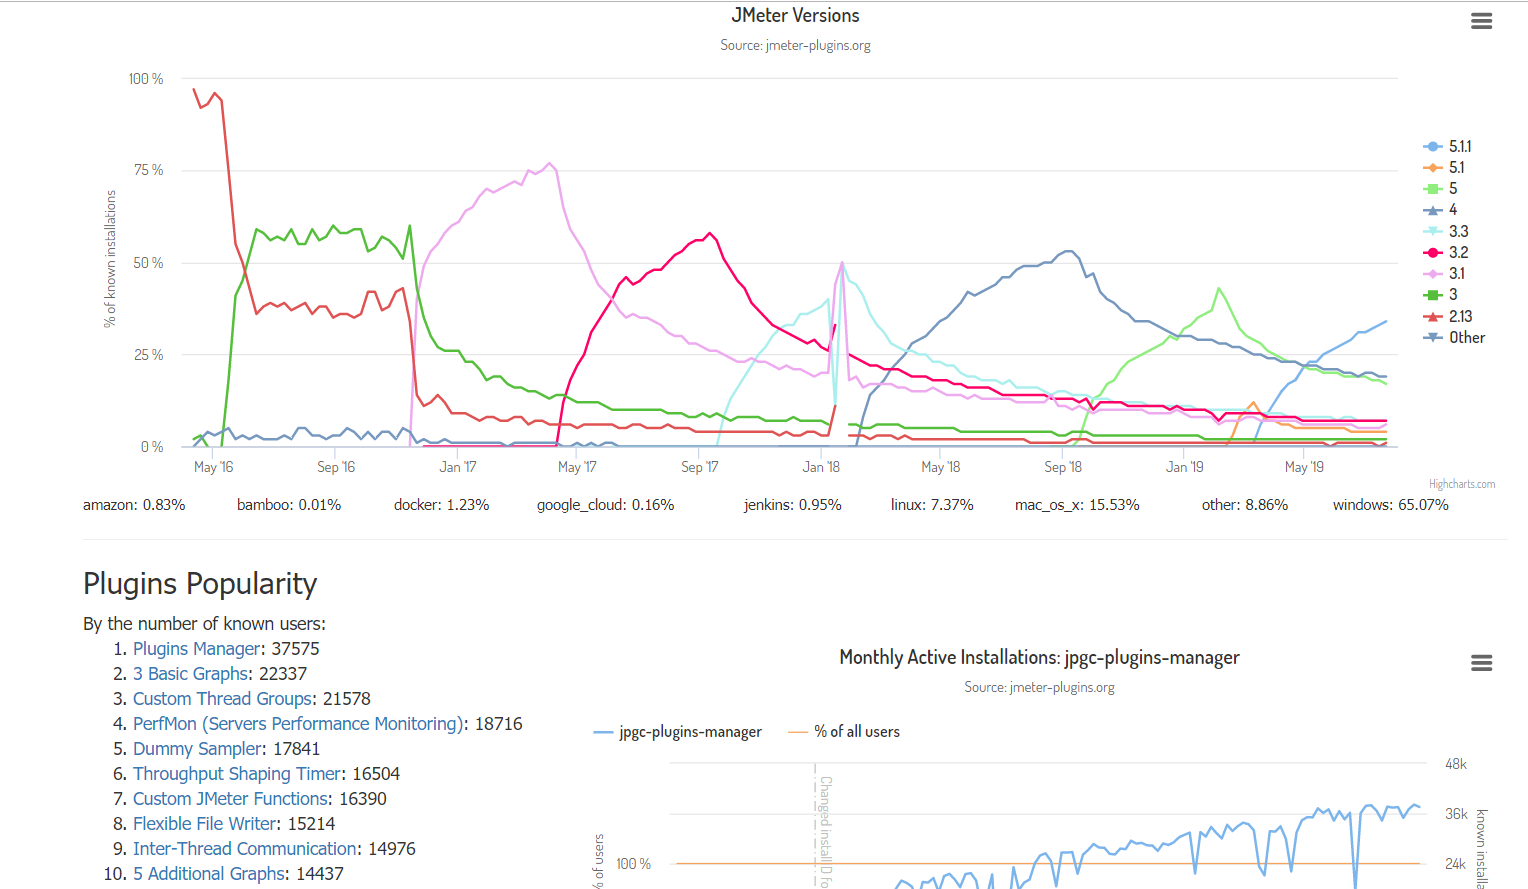
As you can see from the snippet above. The list shows Top 10 JMeter Plugins.
NOTE: This is Monthly Data. So might fluctuate at the time of blog post-reading.
Now Let’s begin by discussing these plugins in detail covering installation, usage, and basic characteristics. We will be discussing the Plugins in the hierarchy beginning with the most popular to least popular.
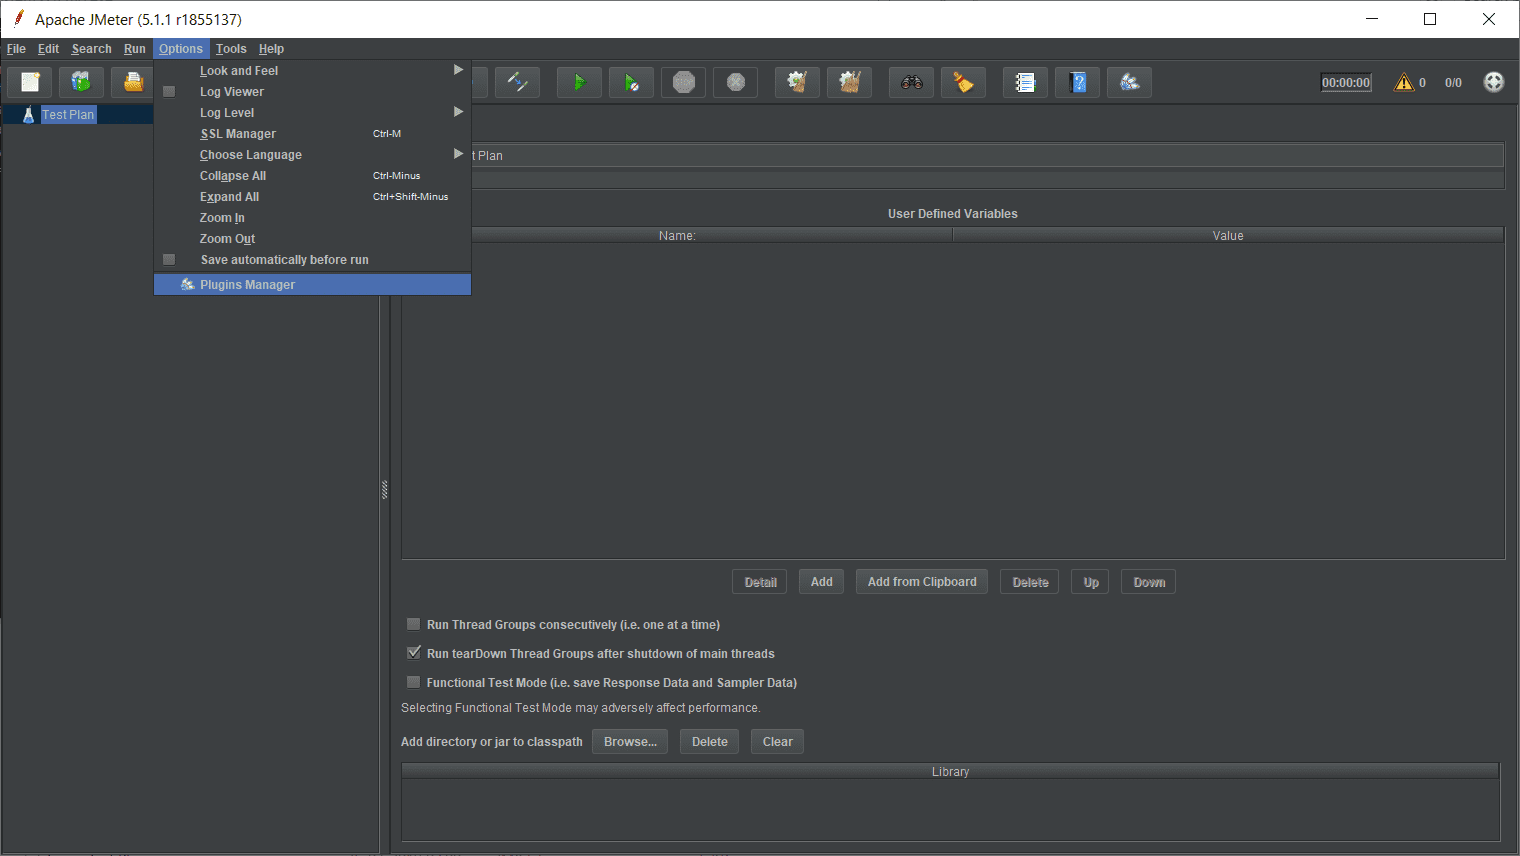
1. Winner-Plugins Manager You might be wondering what is so special about this Plugin that it is at No.1 place. Downloading and Installing plugins in JMeter cannot be done directly. They need a catalyst to do this job. This catalyst is none other than the Plugins Manager. The user needs to install the Plugins Manager before any other Plugin. This is the easiest and convenient way to manage Plugins in JMeter.
How to Install Plugins Manager:
You might be still thinking about what is special about the Plugins Manager that it makes life so easy. The Answer is all other Plugins don’t need special download and installation. To download a Plugin all one needs is to click the checkbox in front of the name of the desired plugin inside the Plugins Manager window.
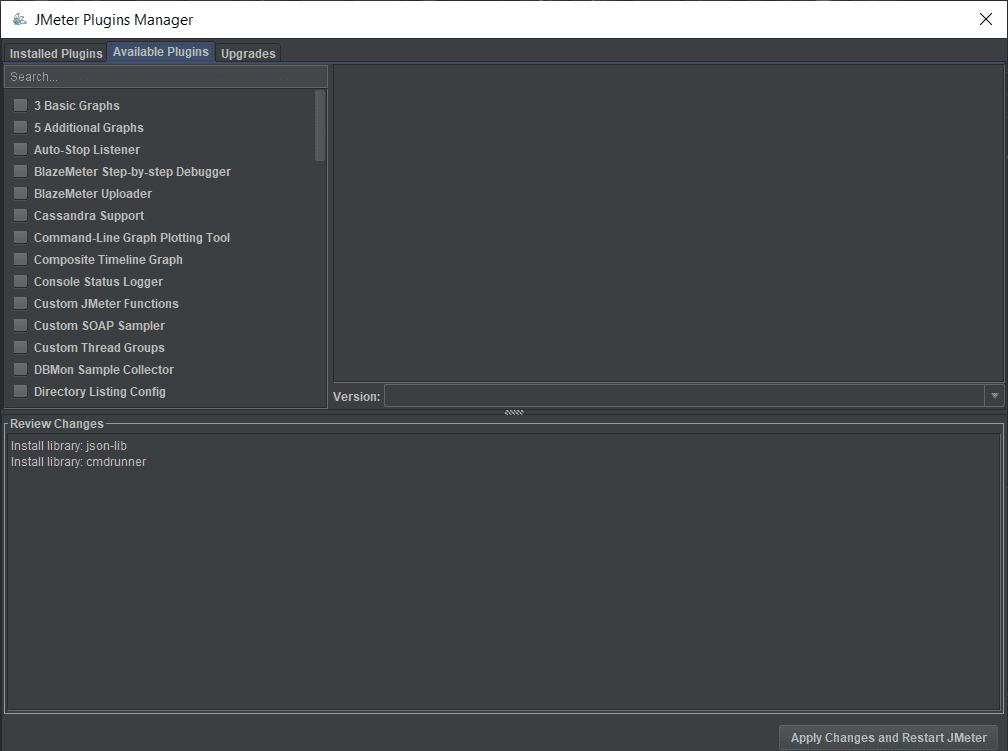
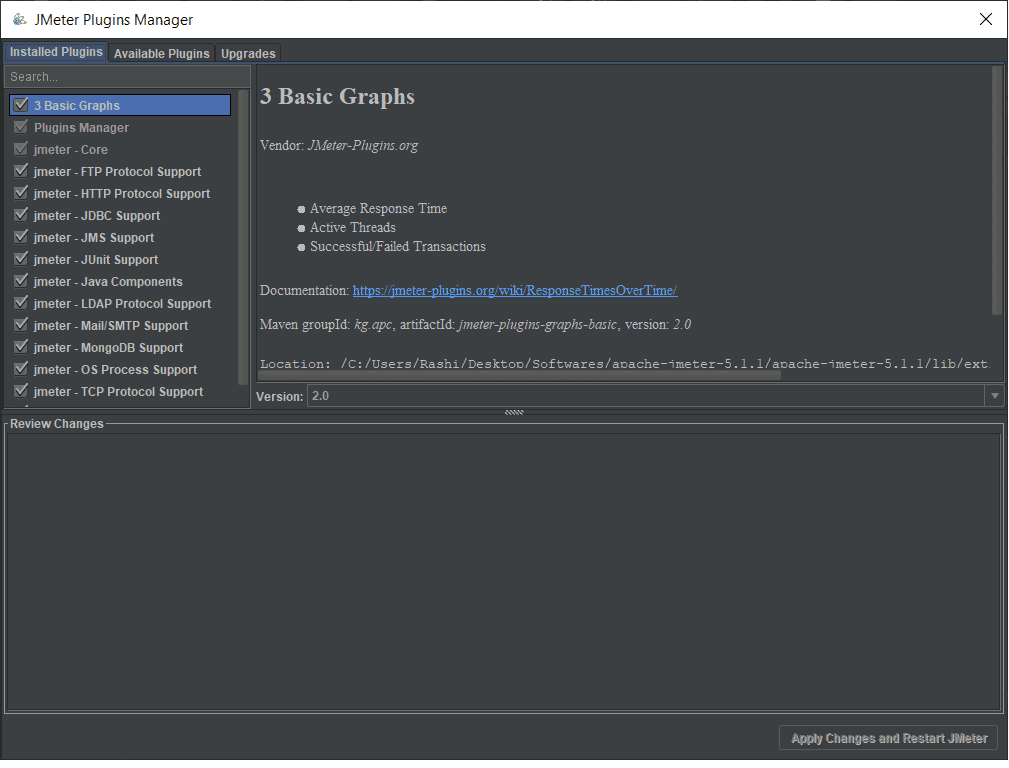
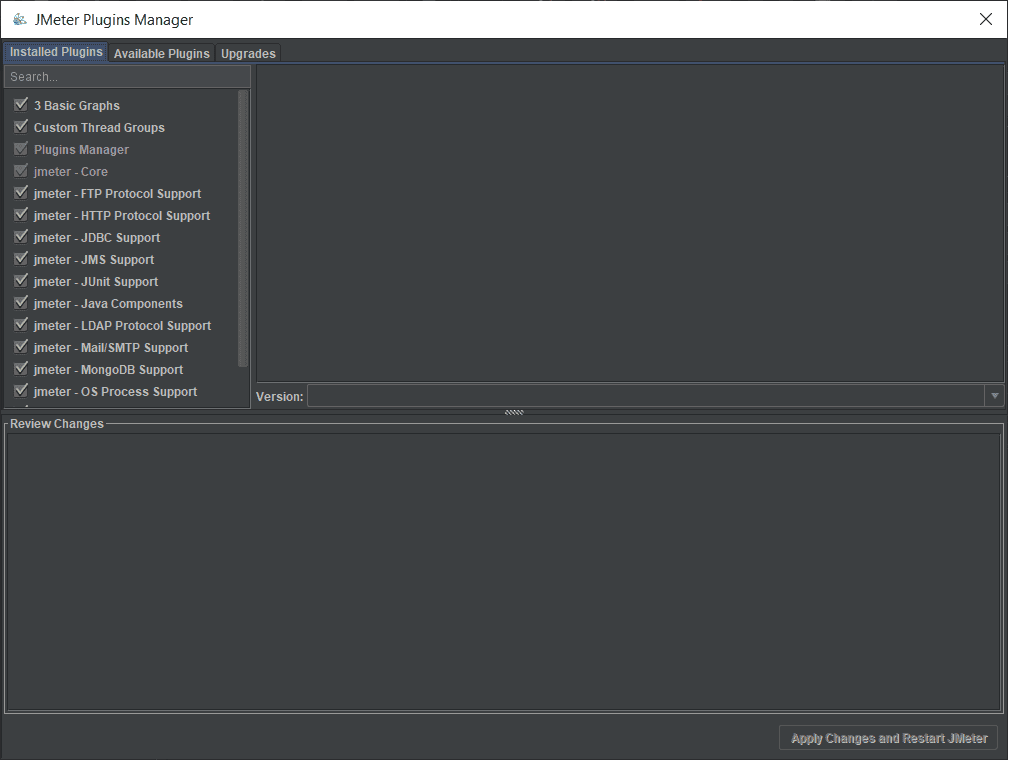
The Plugins Manager has three tabs: Installed Plugins, Available Plugins, and Upgrades.
Installed Plugins: This tab shows the list of installed plugins, description area and a review change area at the bottom.
Available Plugins: This shows the list of available plugins, description and review area at the bottom. You can use the search button to find the best-suited plugin.
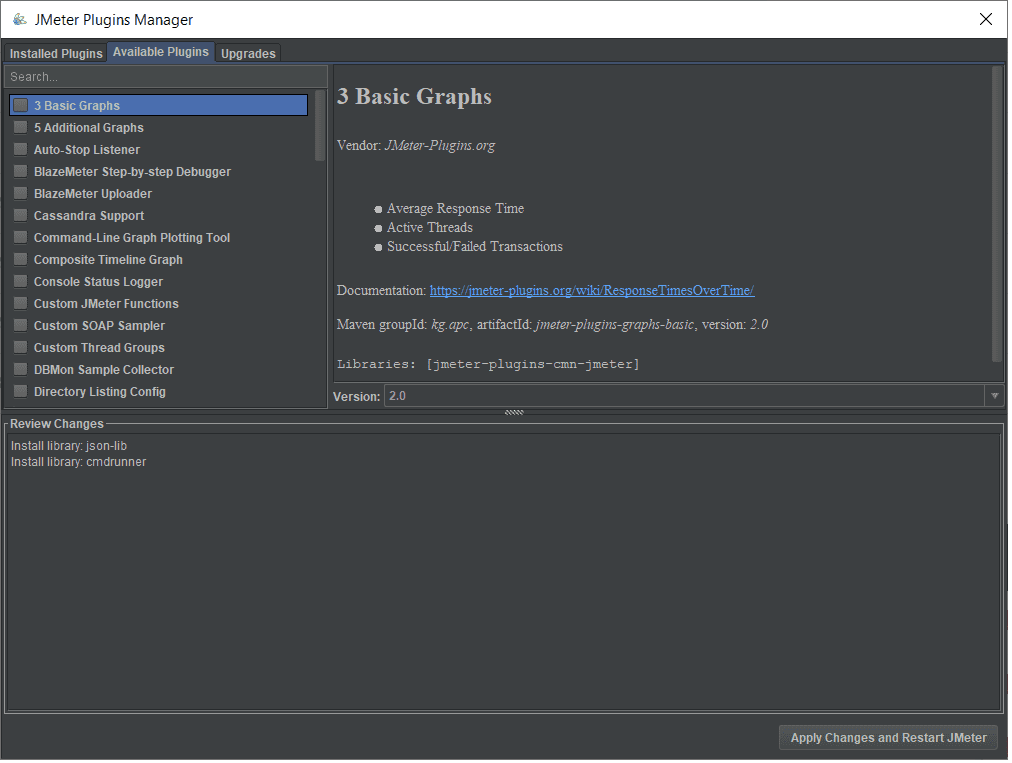
2. 3 Basic Graphs
3 Basic Graphs was designed to serve 3 purposes or we can say it adds 3 types of Listener to the JMeter serving 3 very important tasks:
These Listeners provide data in the Graphic form, enabling you to better analyze the results and decide what steps to take in the future.
The Plugin can be downloaded through Plugins Manager by selecting the checkbox in front of 3 Basic Graphs in the list of available Plugins.
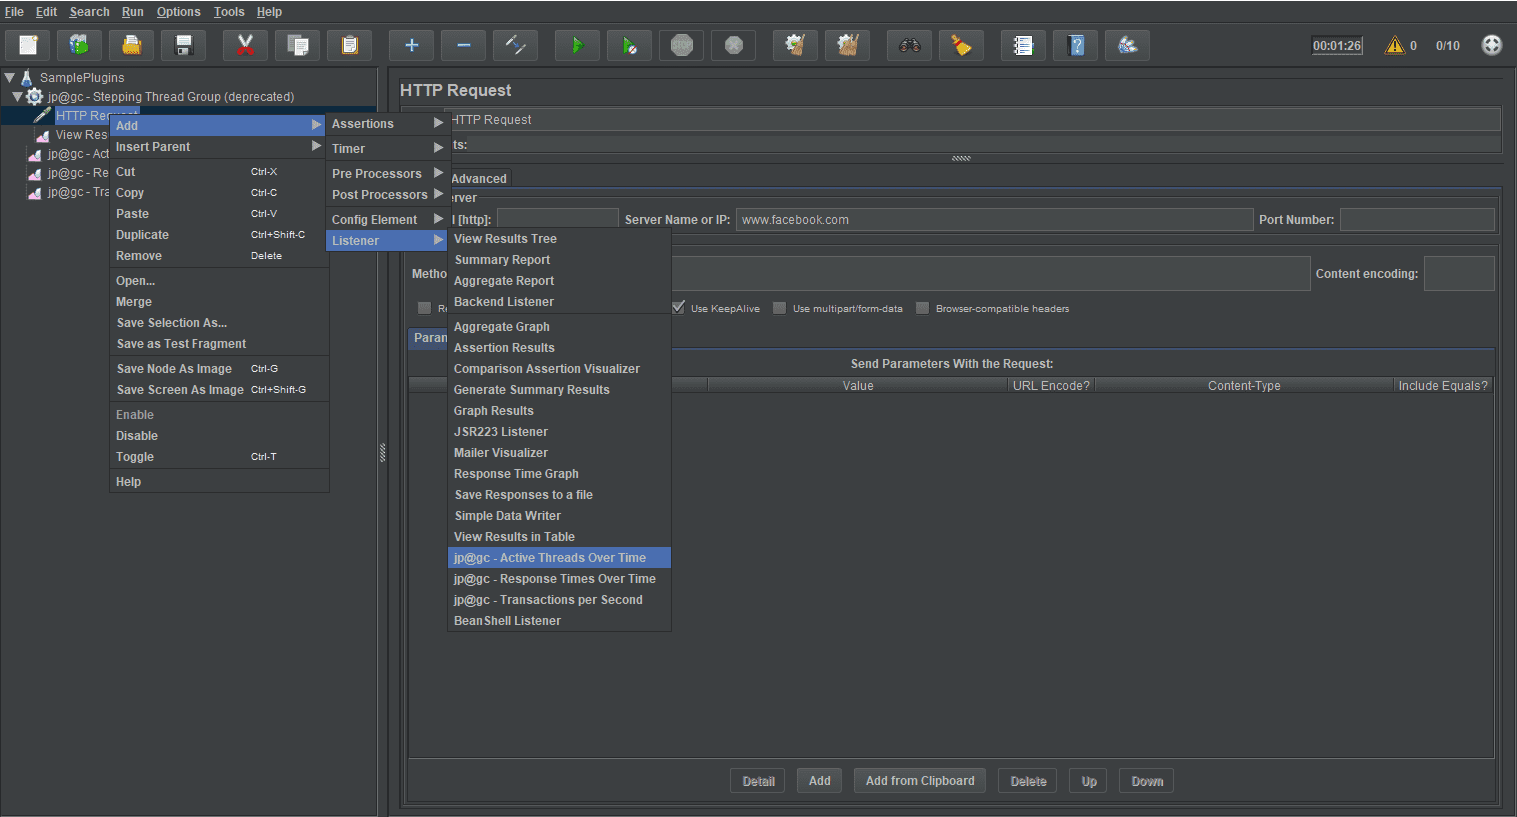
a. Active Threads Over Time: This Listener shows the list of concurrent users active in each thread group during a test run.
How to Add:
NOTE: I have added this Listener to the Test Script Generated in the previous step and then executed the script.
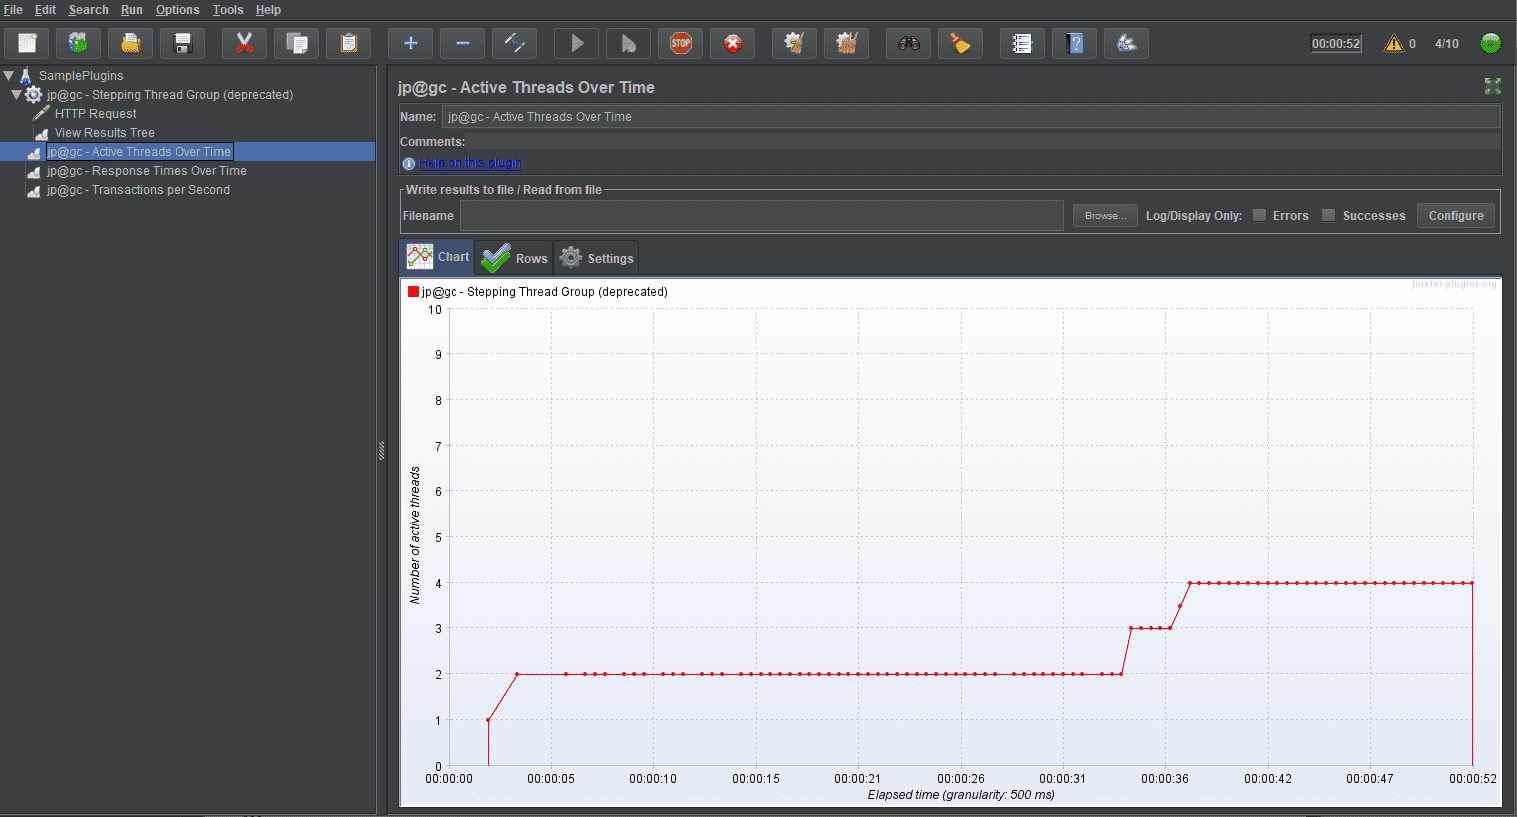
This shows the Graph Generated using Listener Active Threads Over Time.
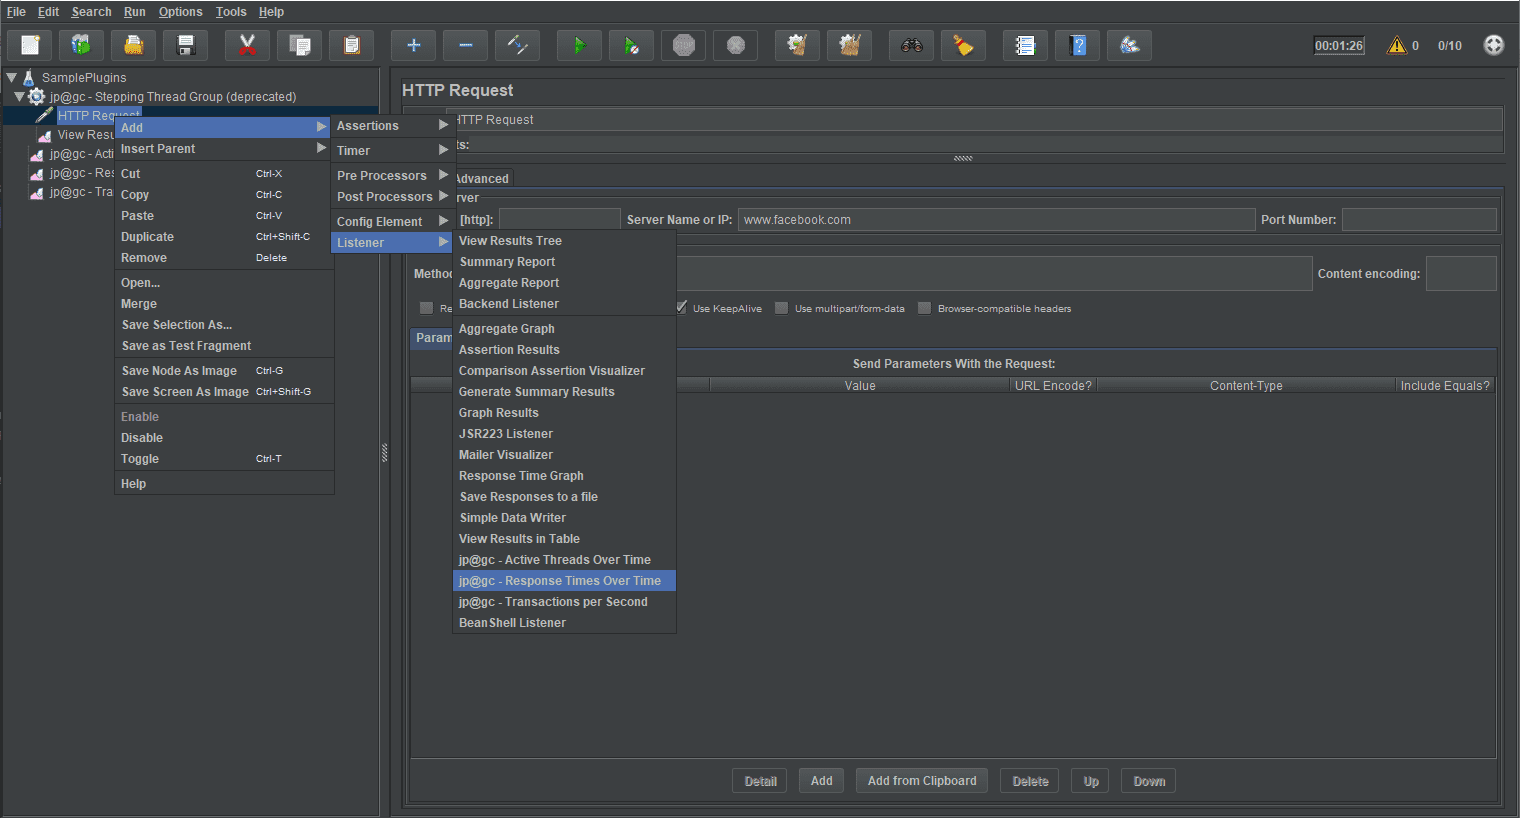
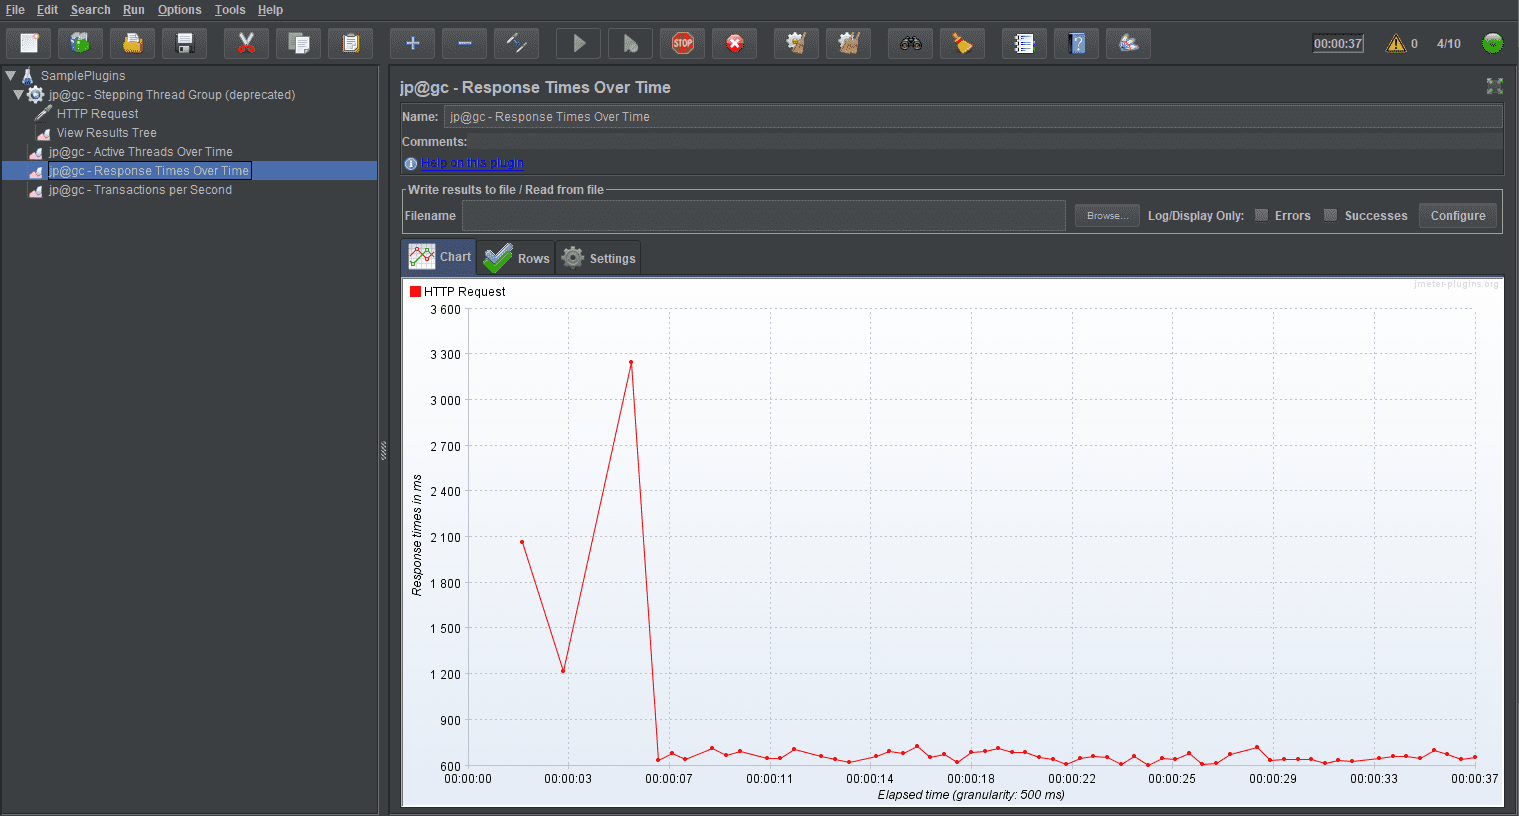
b. Response Times Over Time: This Listener shows the average response time for each sampler during a test run.
How To Add:
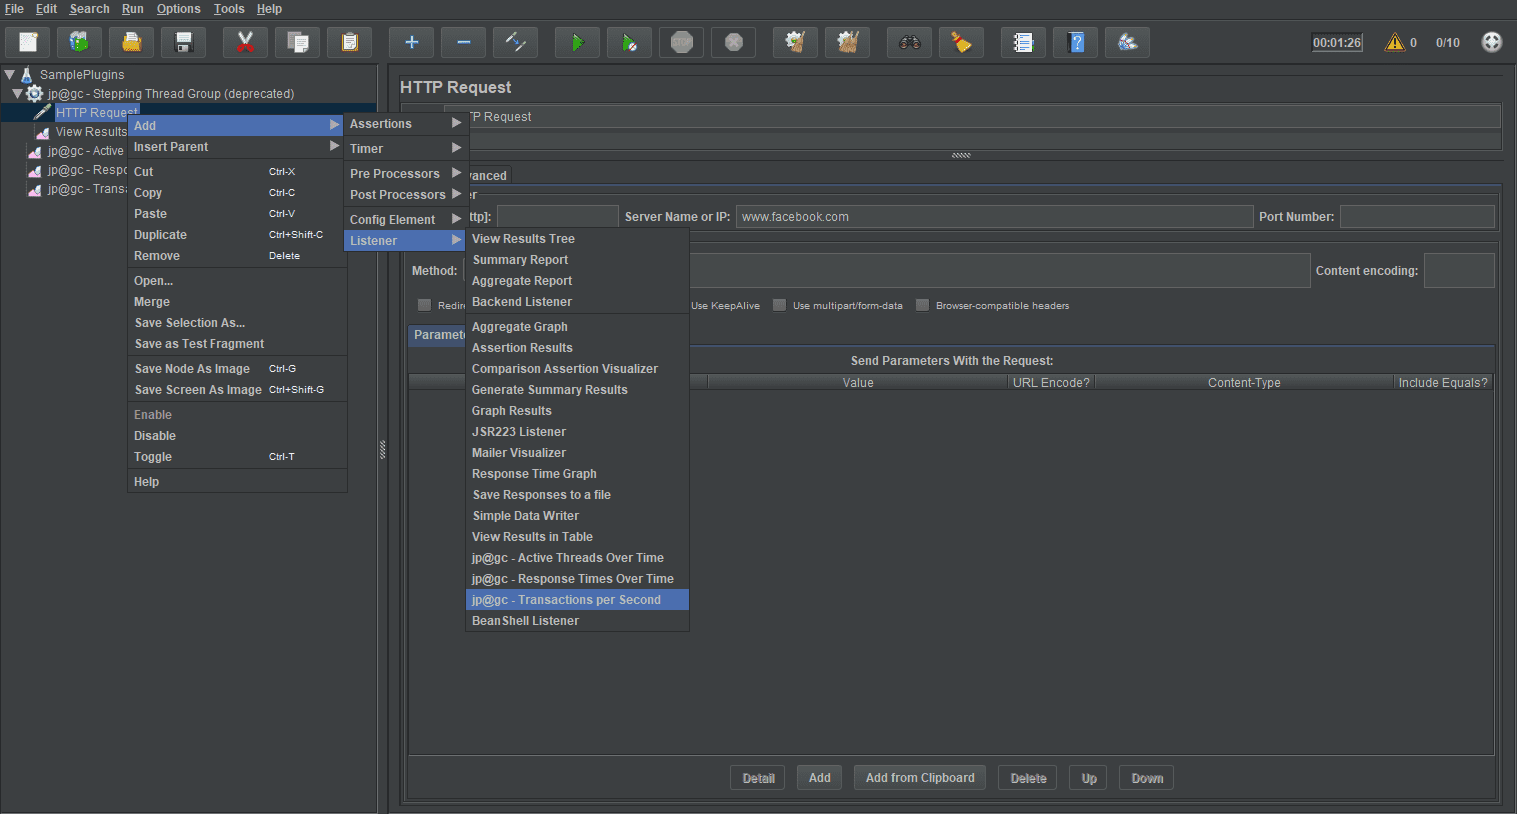
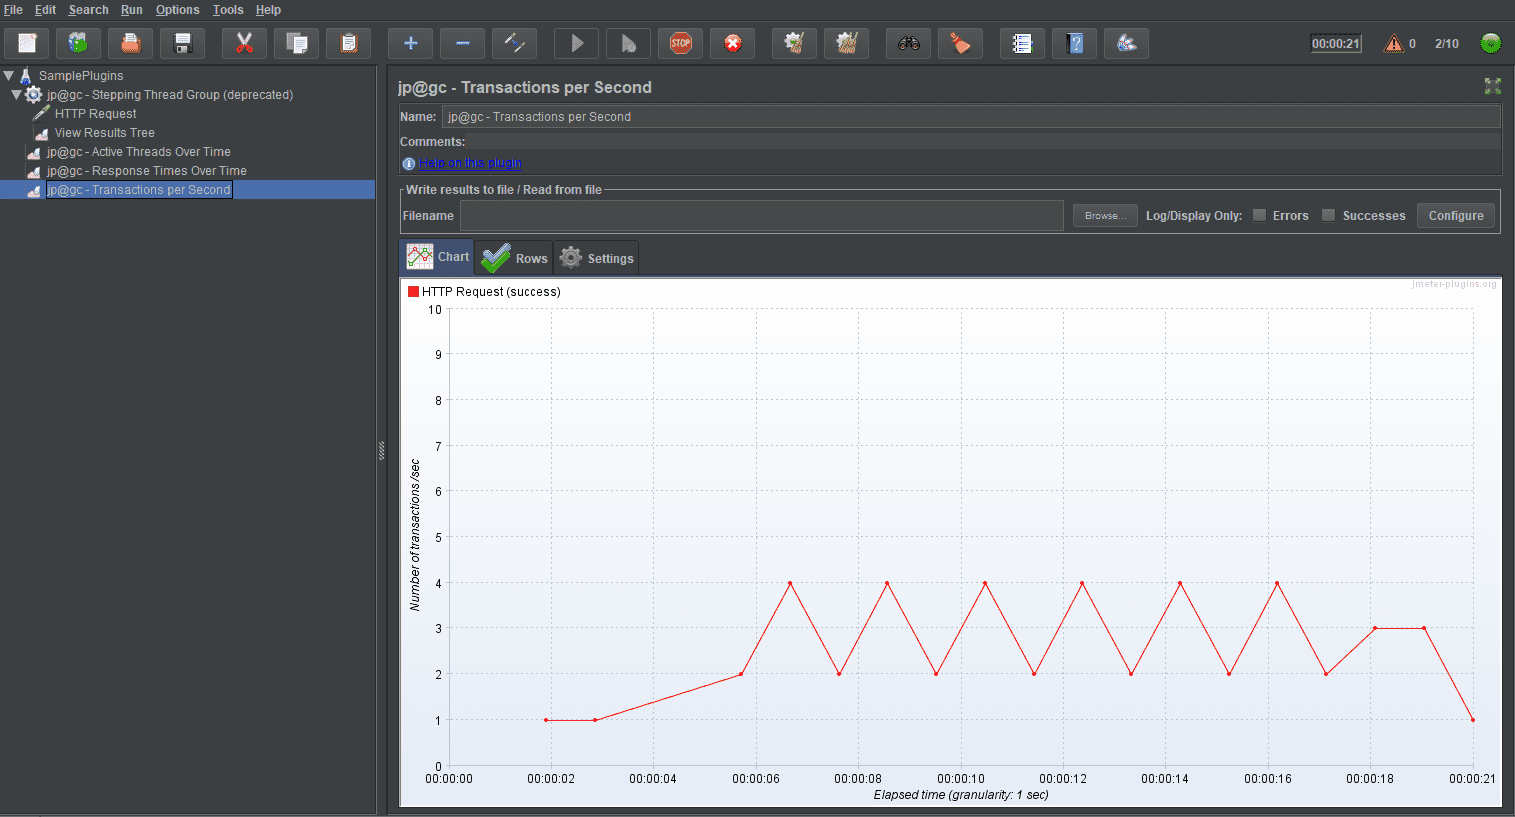
c. Transactions per Second: This Listener shows the number of successful and Failed transactions for each sampler during a test run.
This Listener offers 2 types of Graphs: Detailed Display: where one row is meant for each sampler and Aggregated Display: where all samplers are combined.
How To Add:
3. Custom Thread Groups The Custom Thread Groups add 5 Thread Groups: Stepping Thread Group, Ultimate Thread Group, Concurrency Thread Groups, Arrival Thread Groups, Free-Form Arrivals Thread Group. These thread groups offer a great opportunity to create custom required schedules for the test run.
The Plugin can be installed via the Plugins Manager from the “Options” Menu.
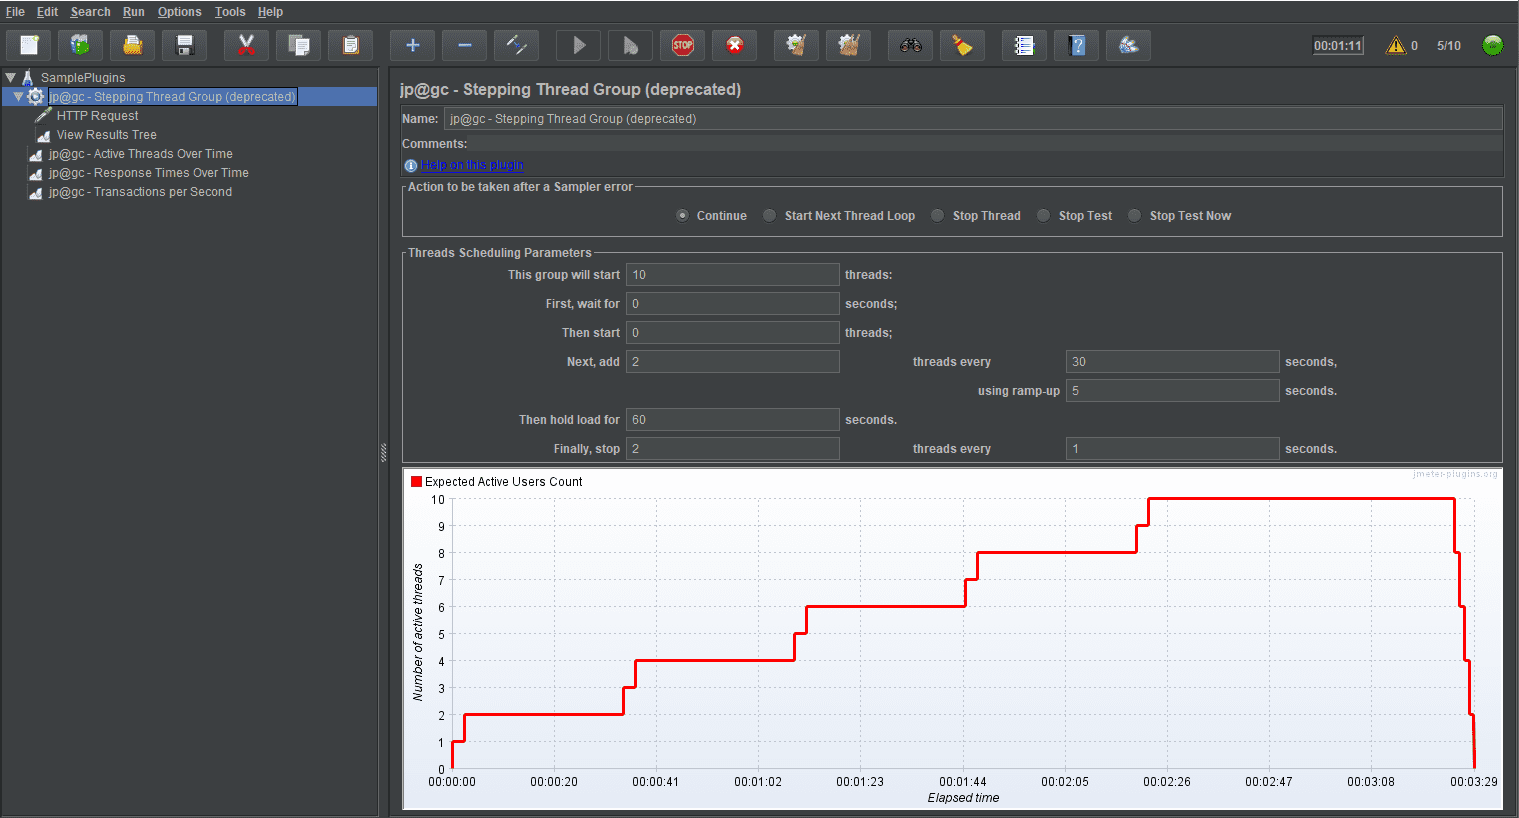
a. Stepping Thread Group: The stepping thread group is a deprecated version. It is a way to create a non-linear stepping schedule for the thread run.
How to Add:
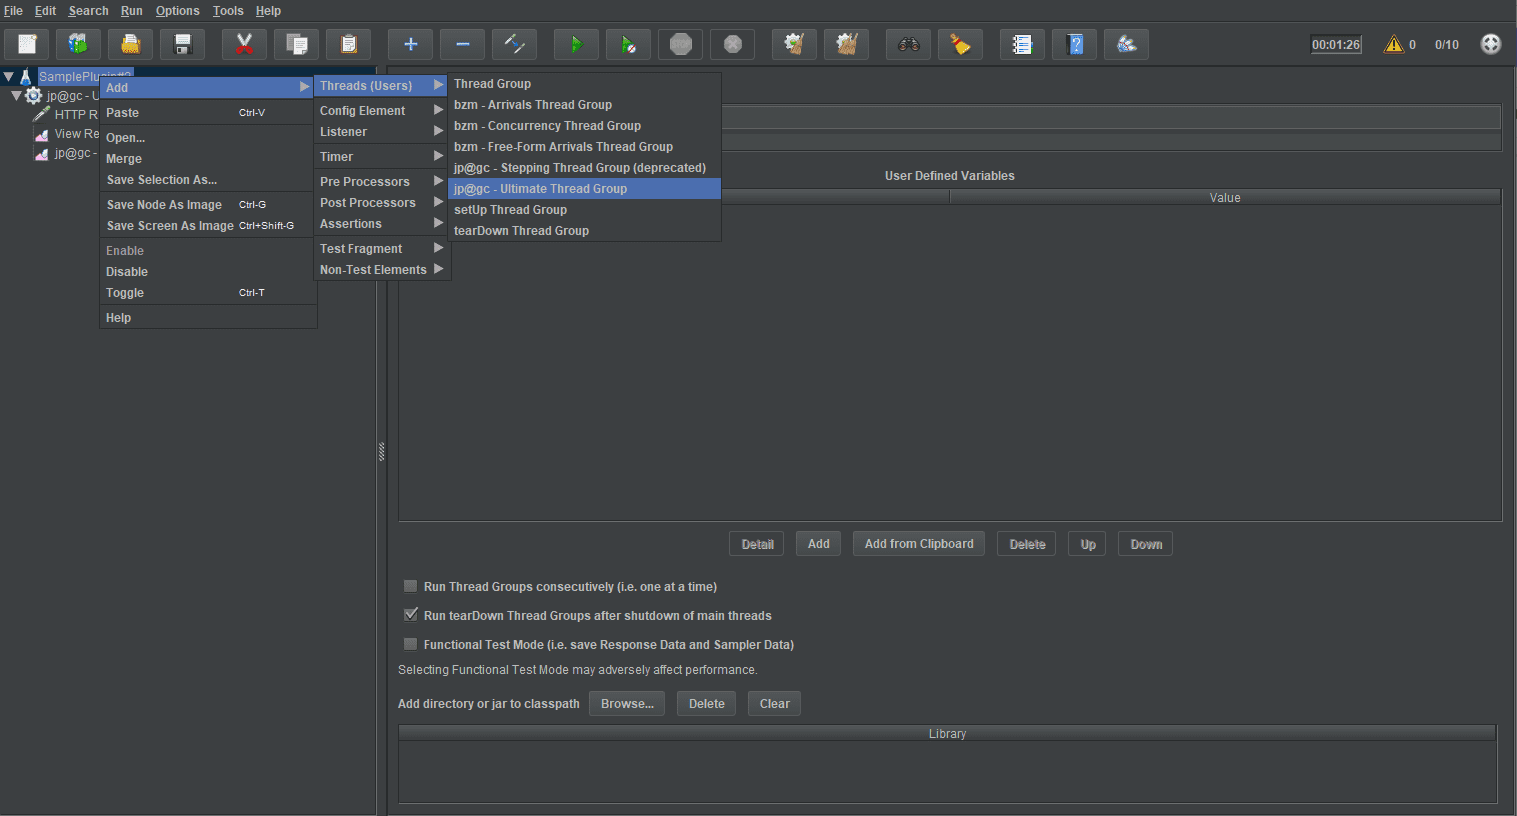
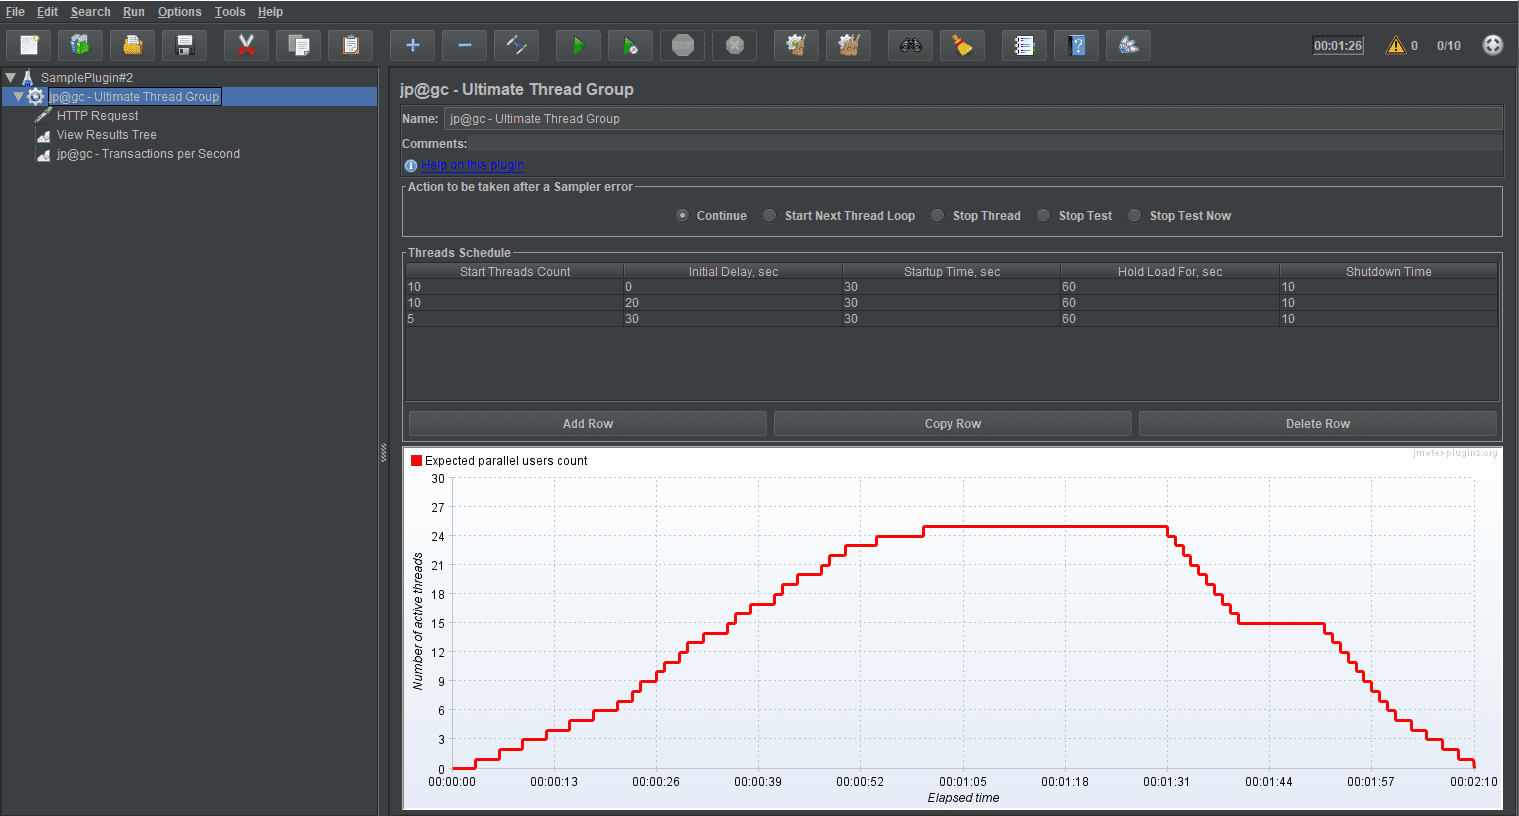
b. Ultimate Thread Group: This Thread Group aims at providing the user with the flexibility of creating almost any type of schedule with almost any type of configuration, in the Threads Schedule Table. It is designed to add flexible test scheduling to your test scenario.
How To Add:
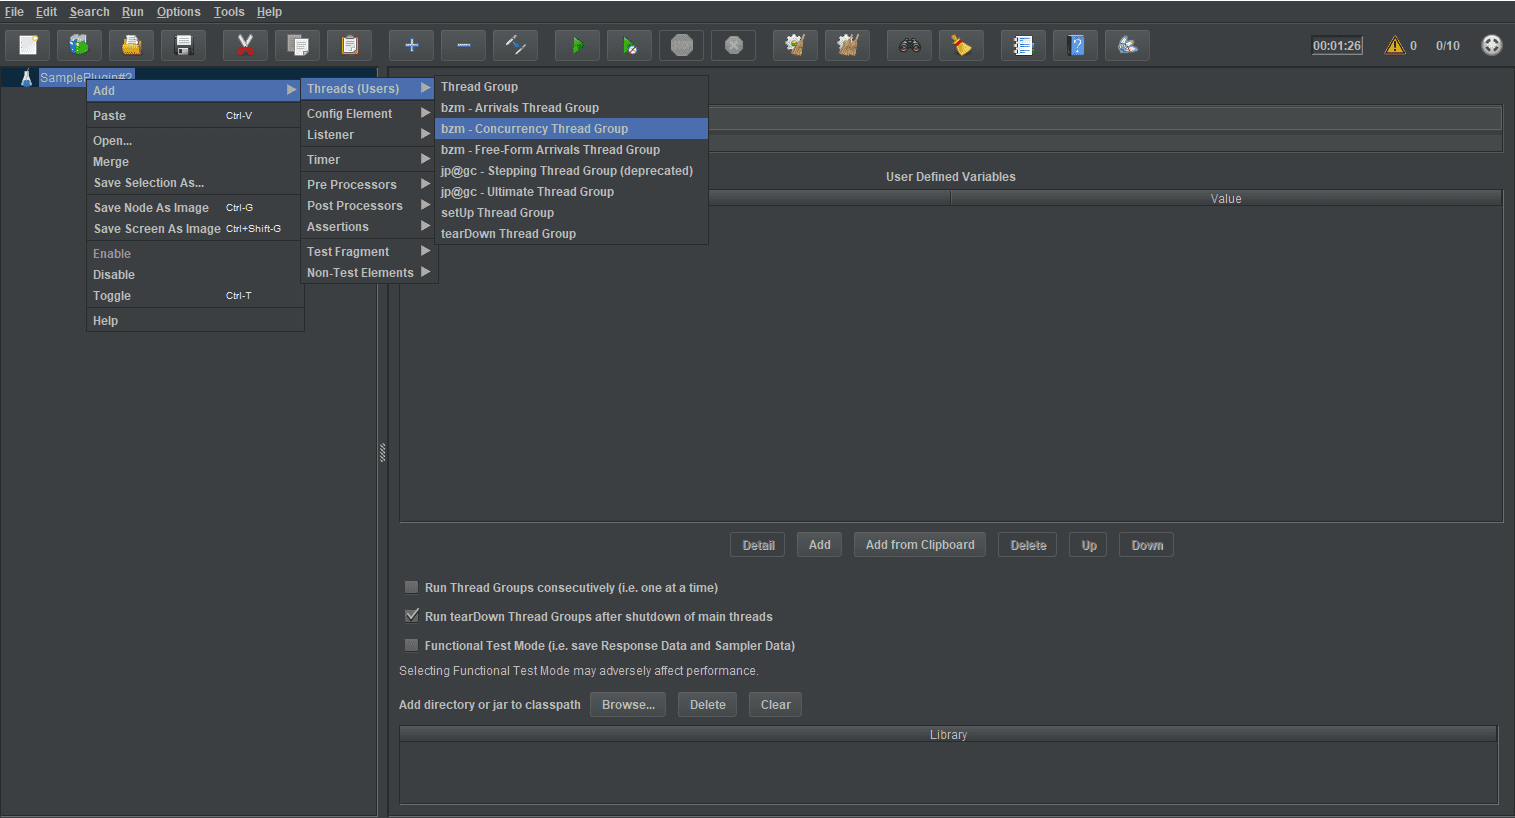
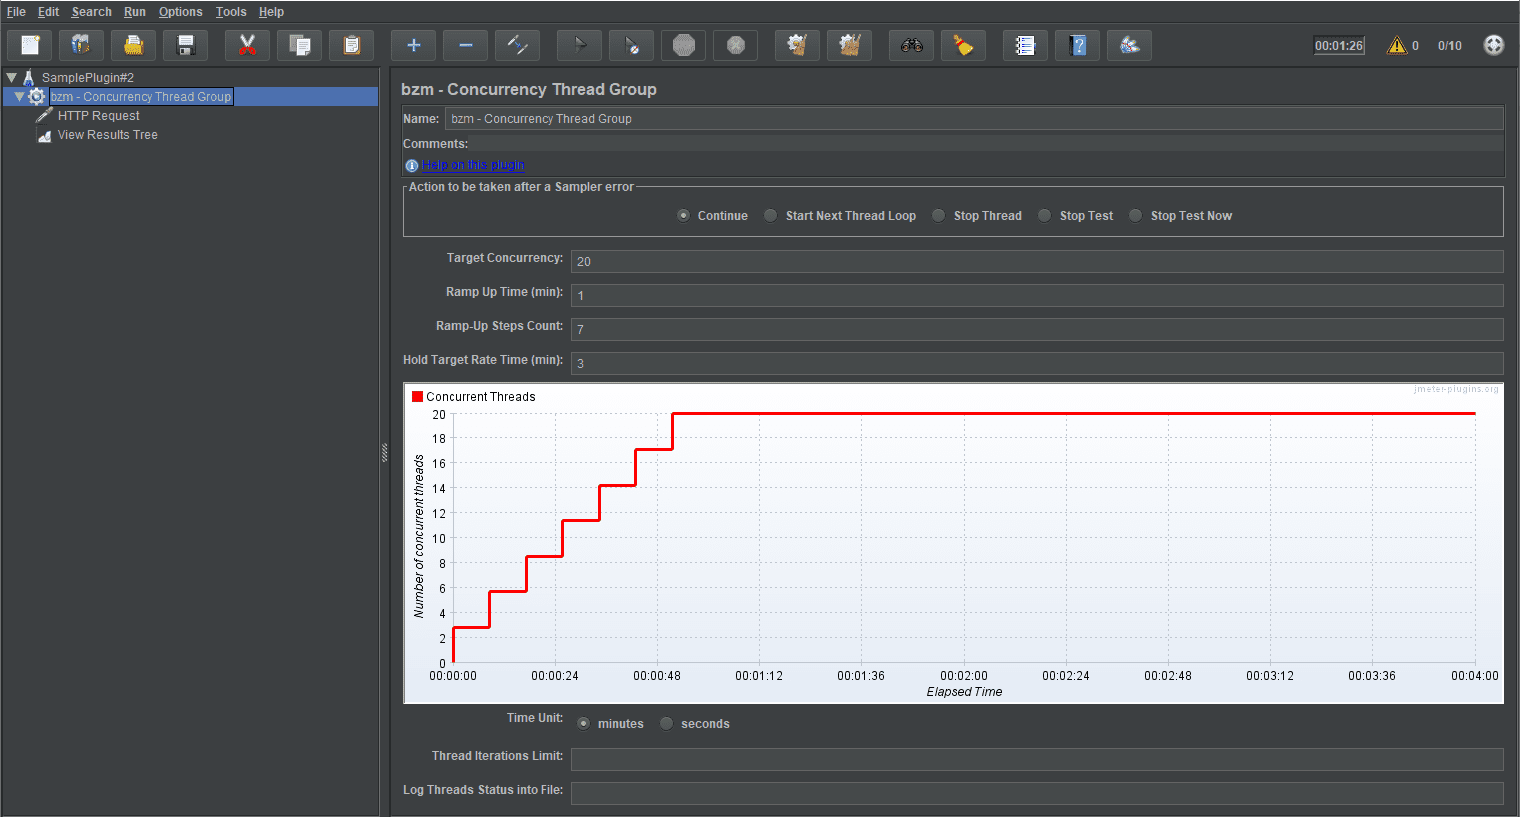
c. Concurrency Thread Group: If you remember we have mentioned earlier that Stepping Thread Group is deprecated. So here is a good alternative for it, if in case it is removed from the future versions. Concurrency Thread Group is the solution. It helps to create a Stepping schedule for the thread runs.
How To Add:
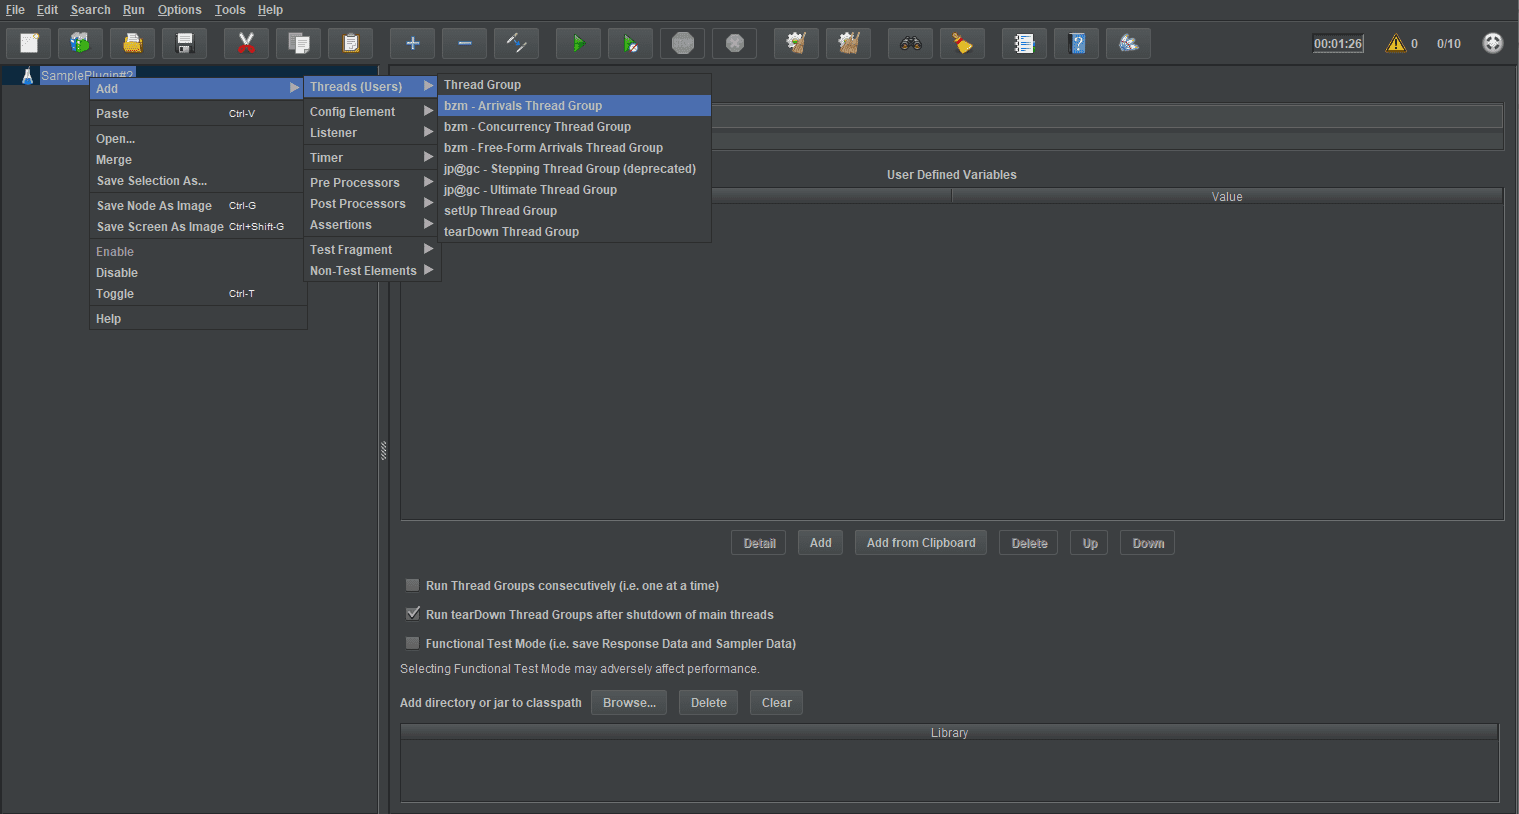
d. Arrival Thread Group: This thread group works on the concept of thread arrival rate in order to determine the load. “Arrival” here means the start of thread iteration.
How To Add:

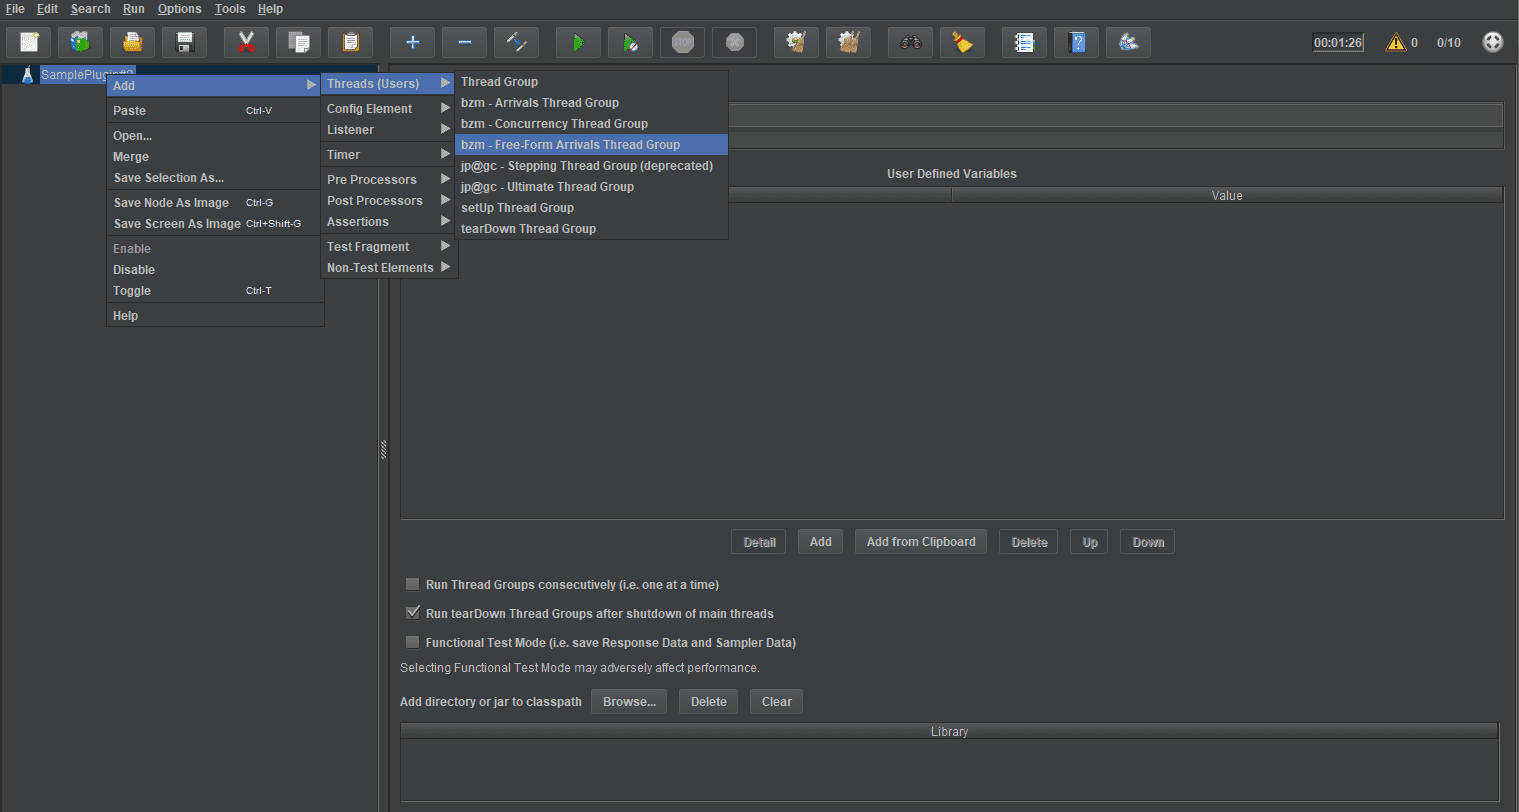
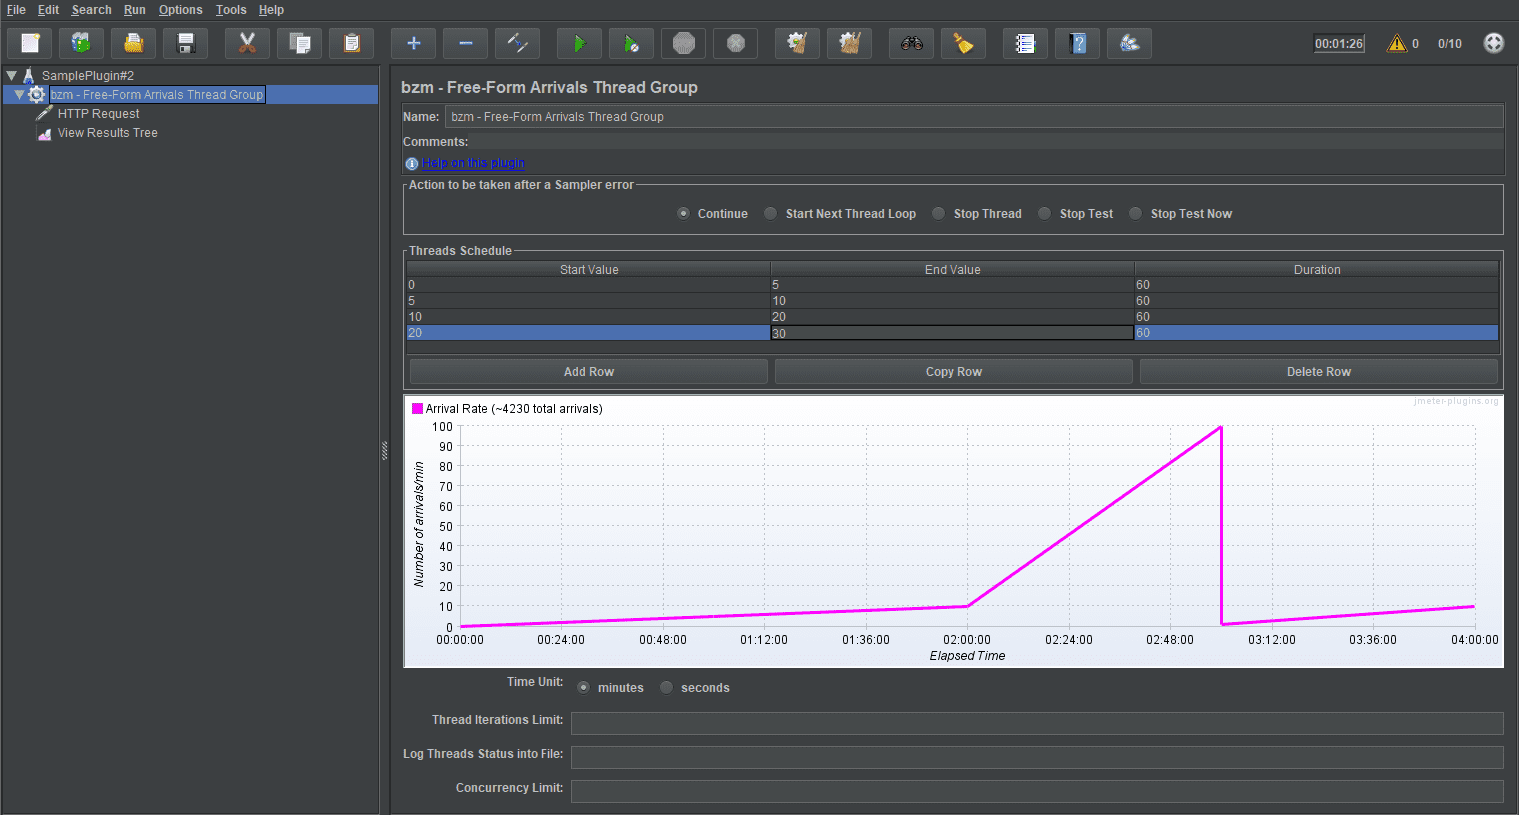
e. Free-Form Arrivals Thread Group: As the name suggests Free-Flow Arrivals Thread Group works with the Arrival schedule but it provides a way to create a flexible schedule.
How To Add:
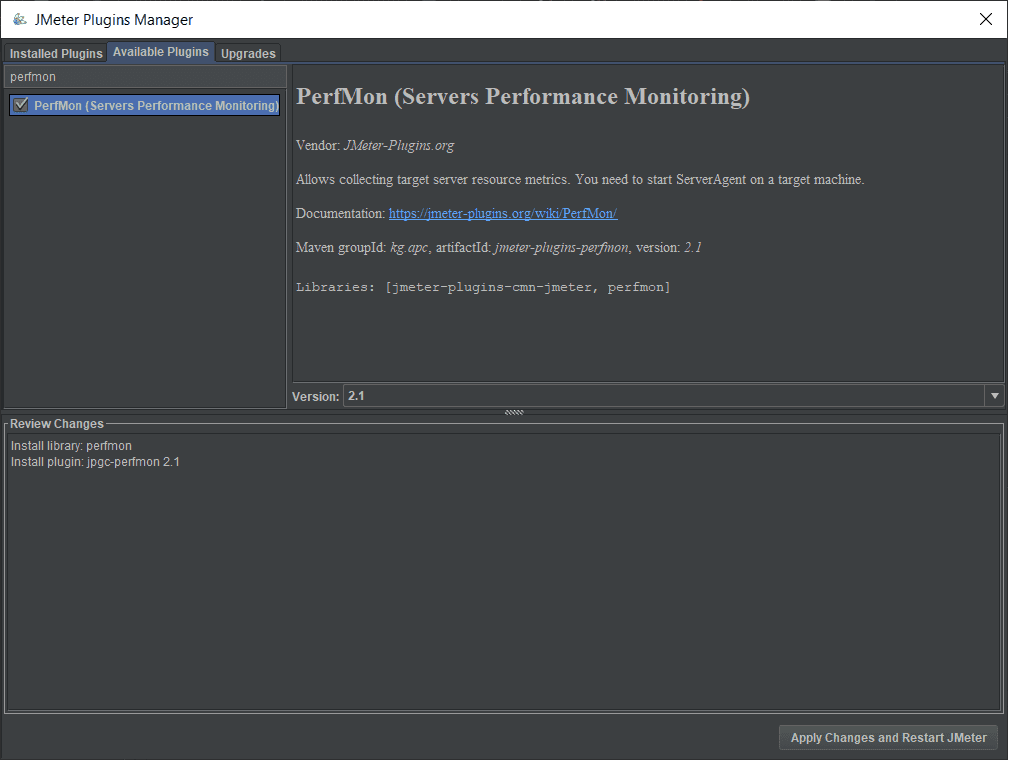
4. PerfMon (Serves Performance Monitoring)
This Plugin adds a Listener “PerfMon Serves Monitoring Performance”. Listener allows us to monitor CPU, Memory, Network I/O, Disk I/O, Swap of the loaded servers.
How to install:
PerfMon Plugin can be installed by clicking the checkbox in front of the PerfMon name in the Plugins Manager.
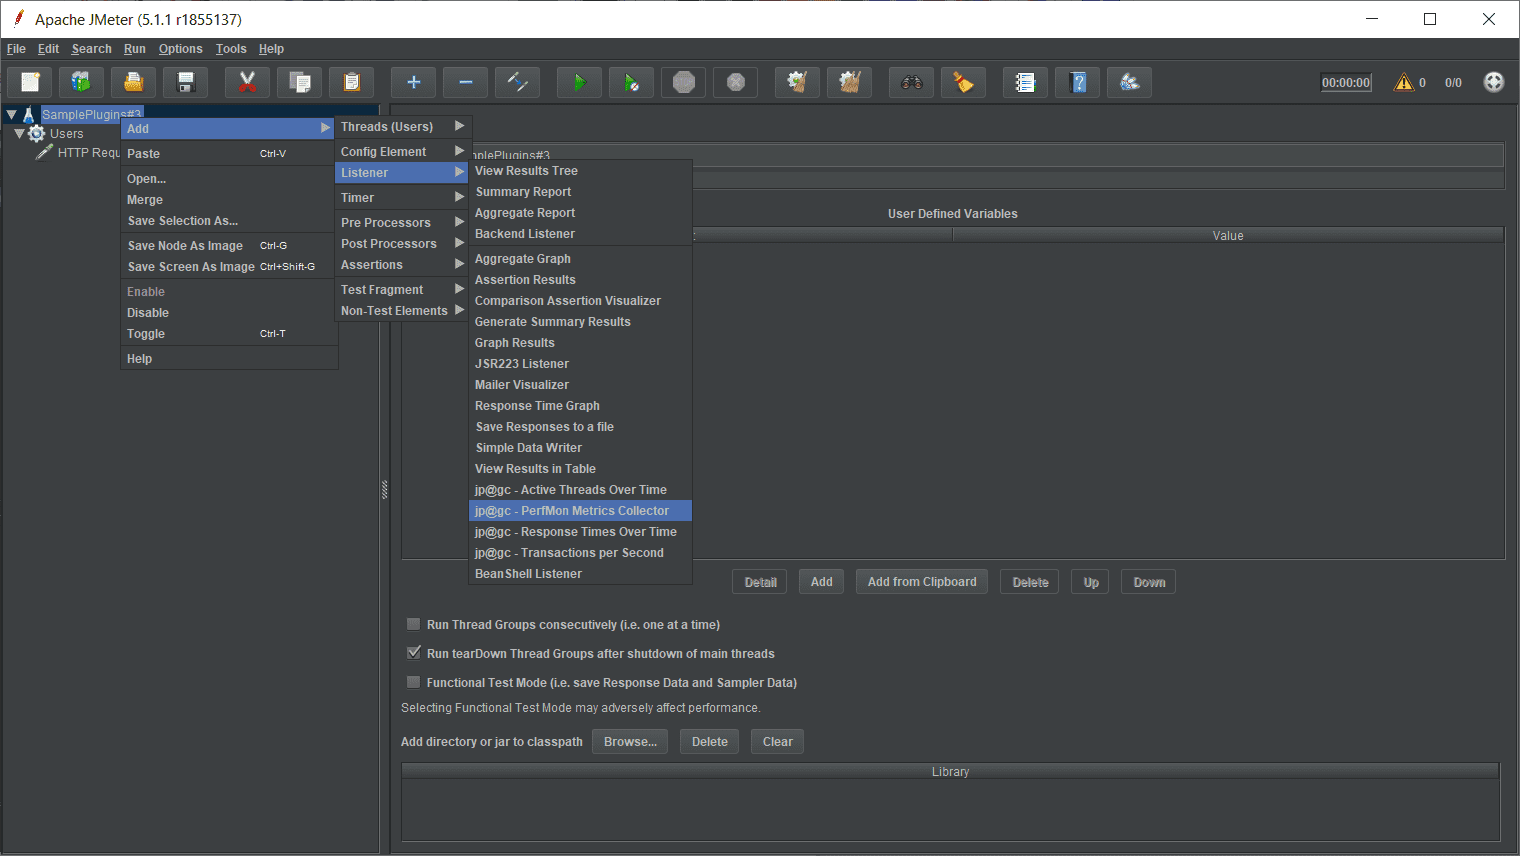
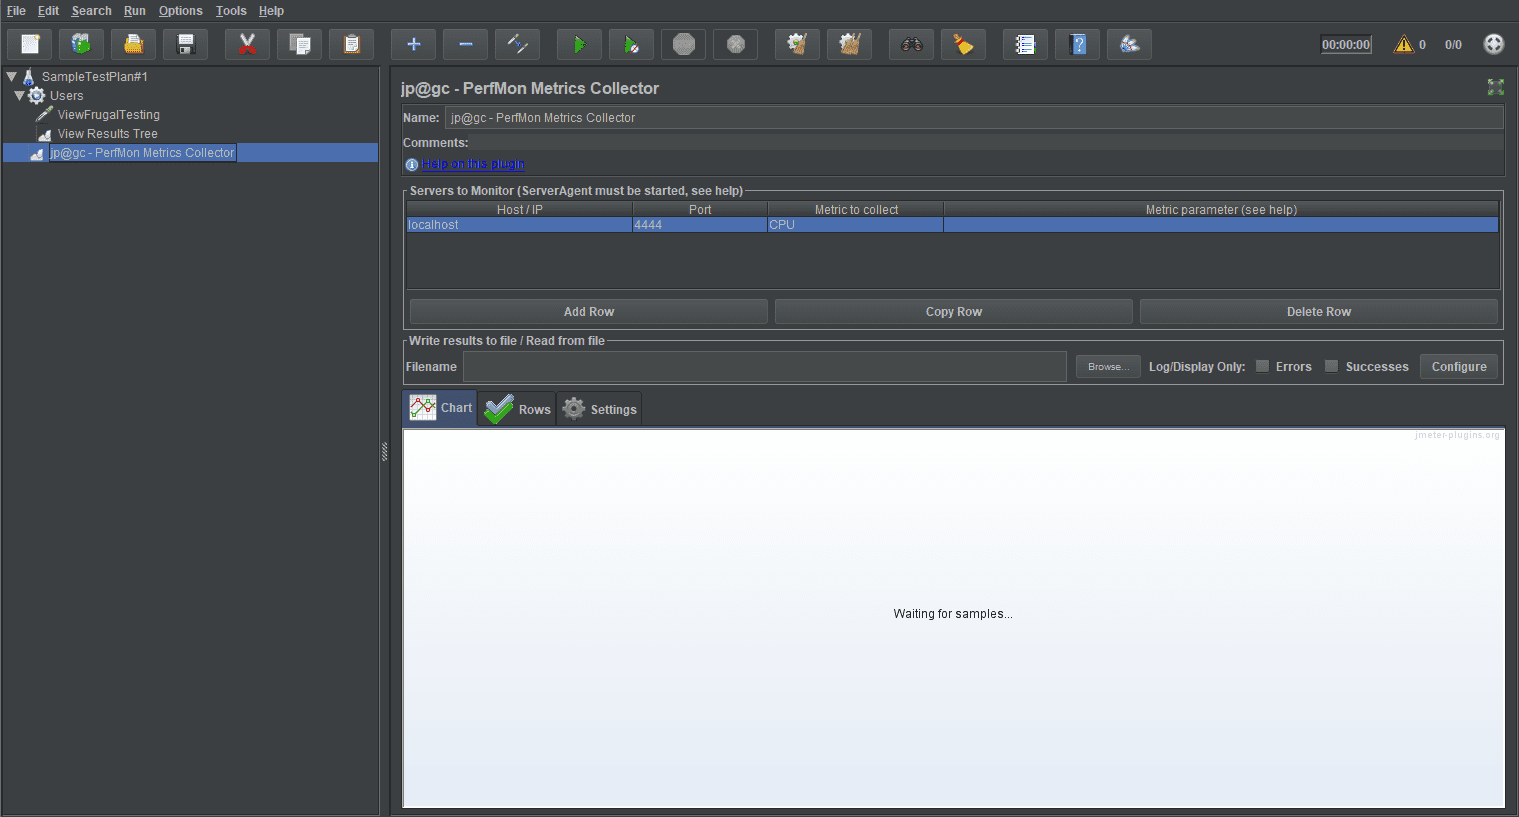
How To Add:
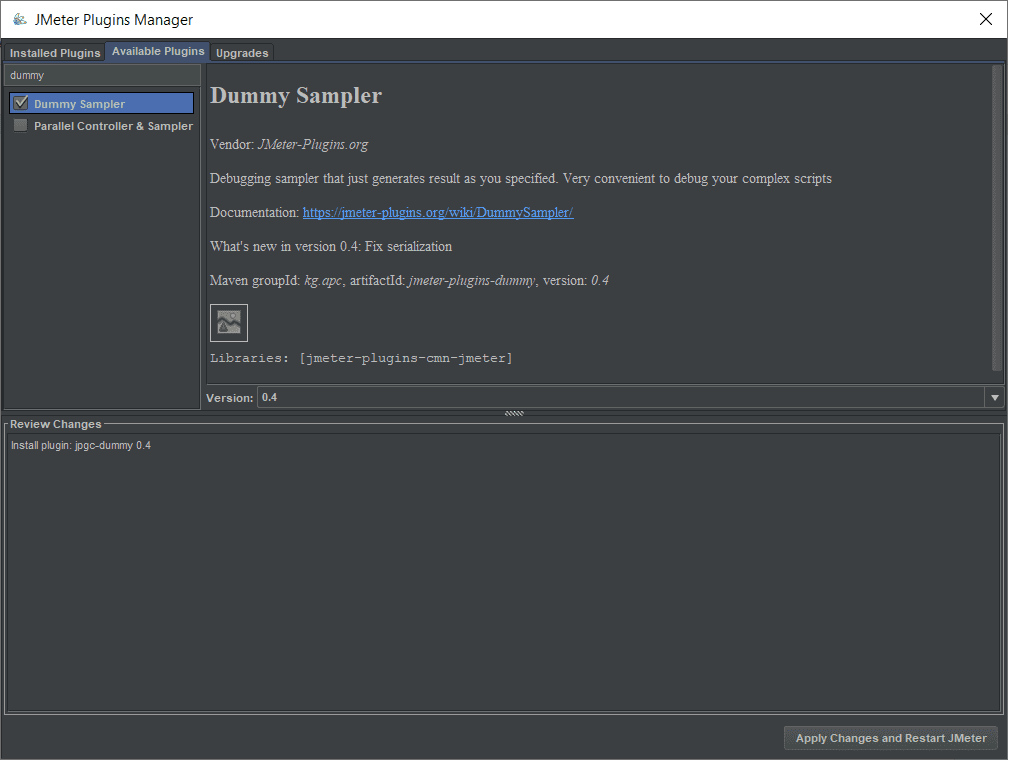
Dummy Sampler Dummy Sampler emulates the work of requests and response without actually running the requests, thus providing a very easy and convenient way to debug post-processors and extractors. The Request and Response data are defined in the sampler’s field.
How To Install:
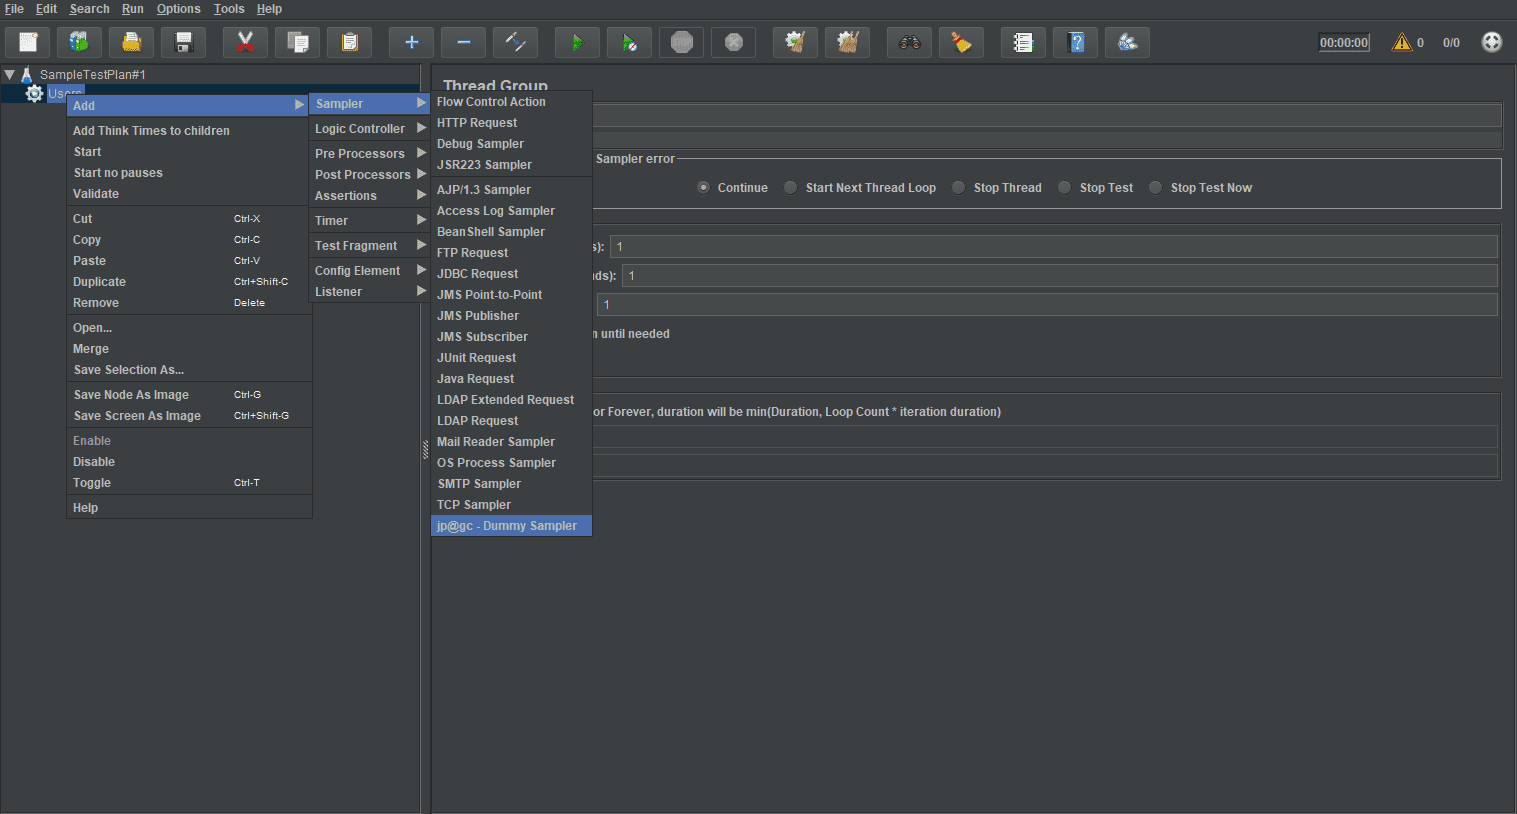
How To Add:
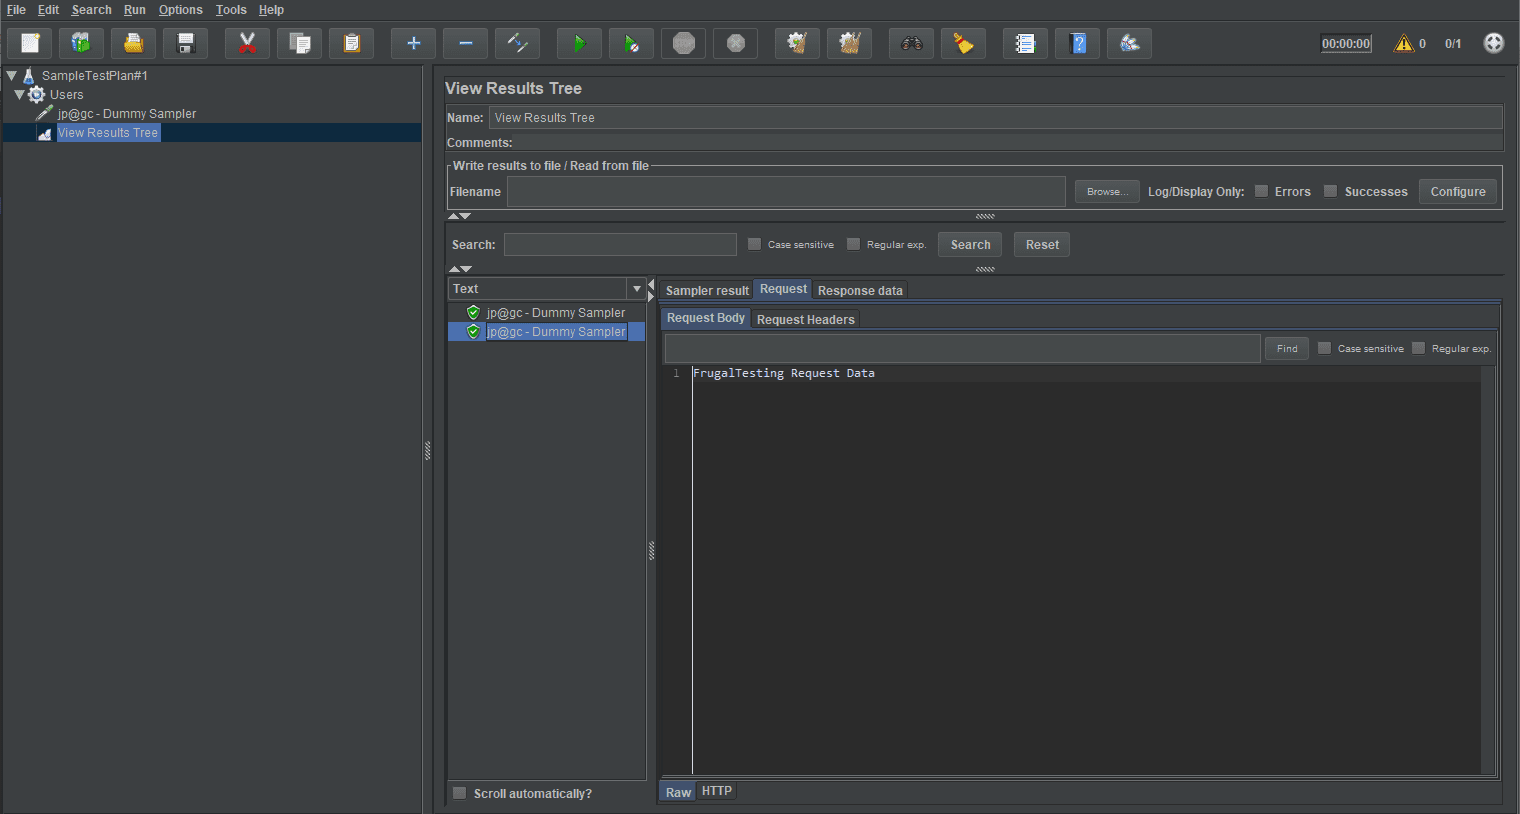
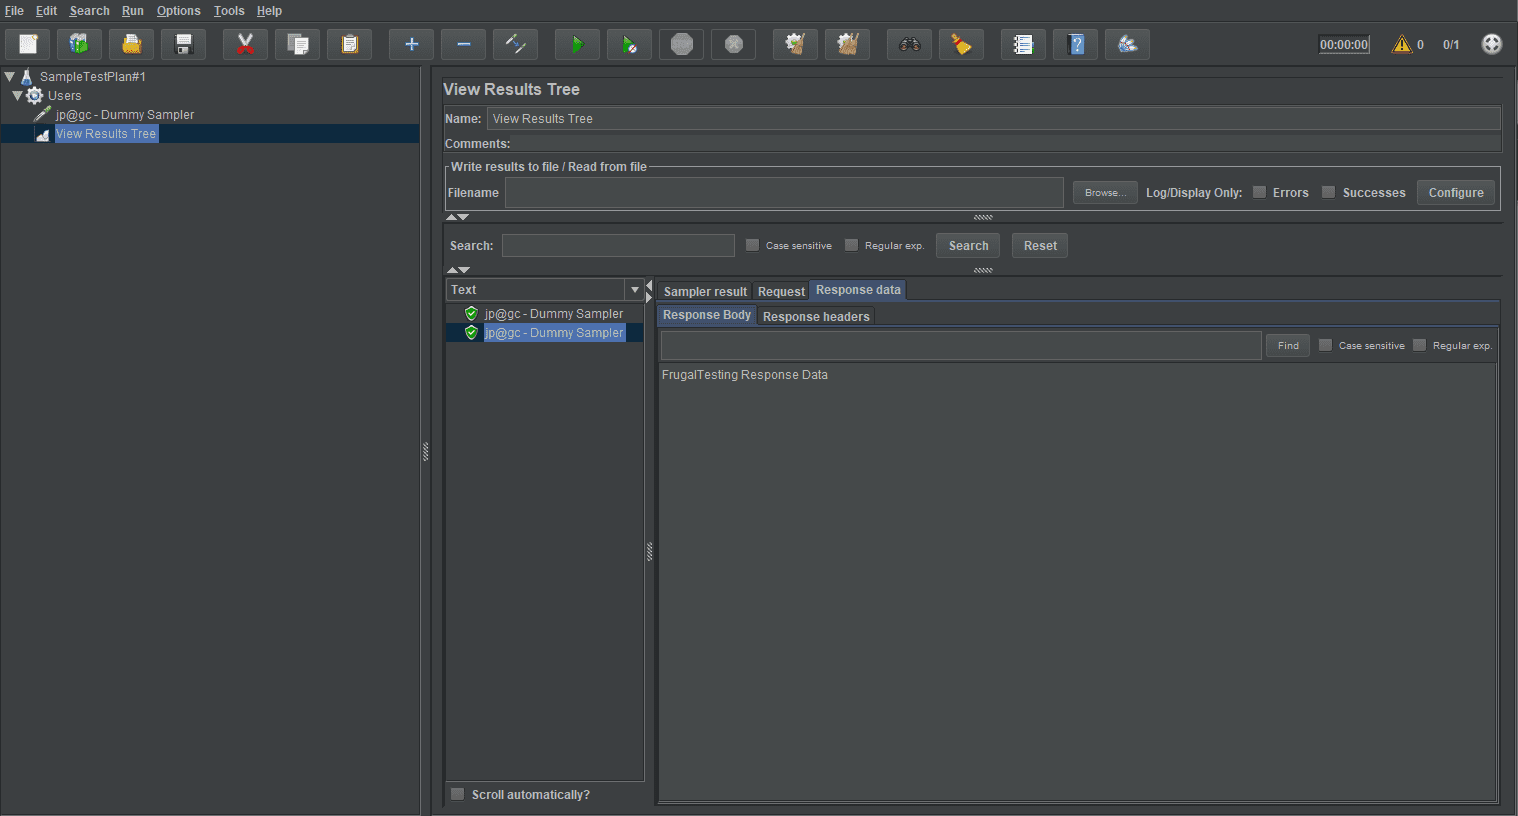
Here is what the dummy sampler looks like after the Test Plan is executed. Looking at the results in the ViewResultsTree.
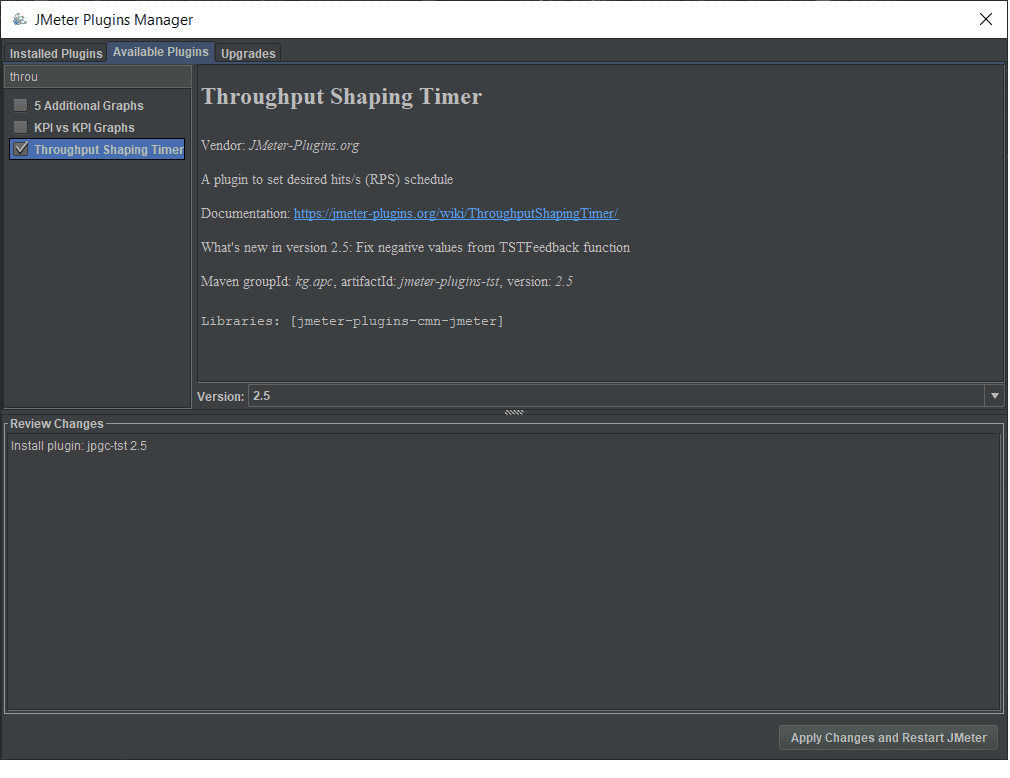
6. Throughput Shaping Timer This plugin adds 3 functionality to the JMeter:
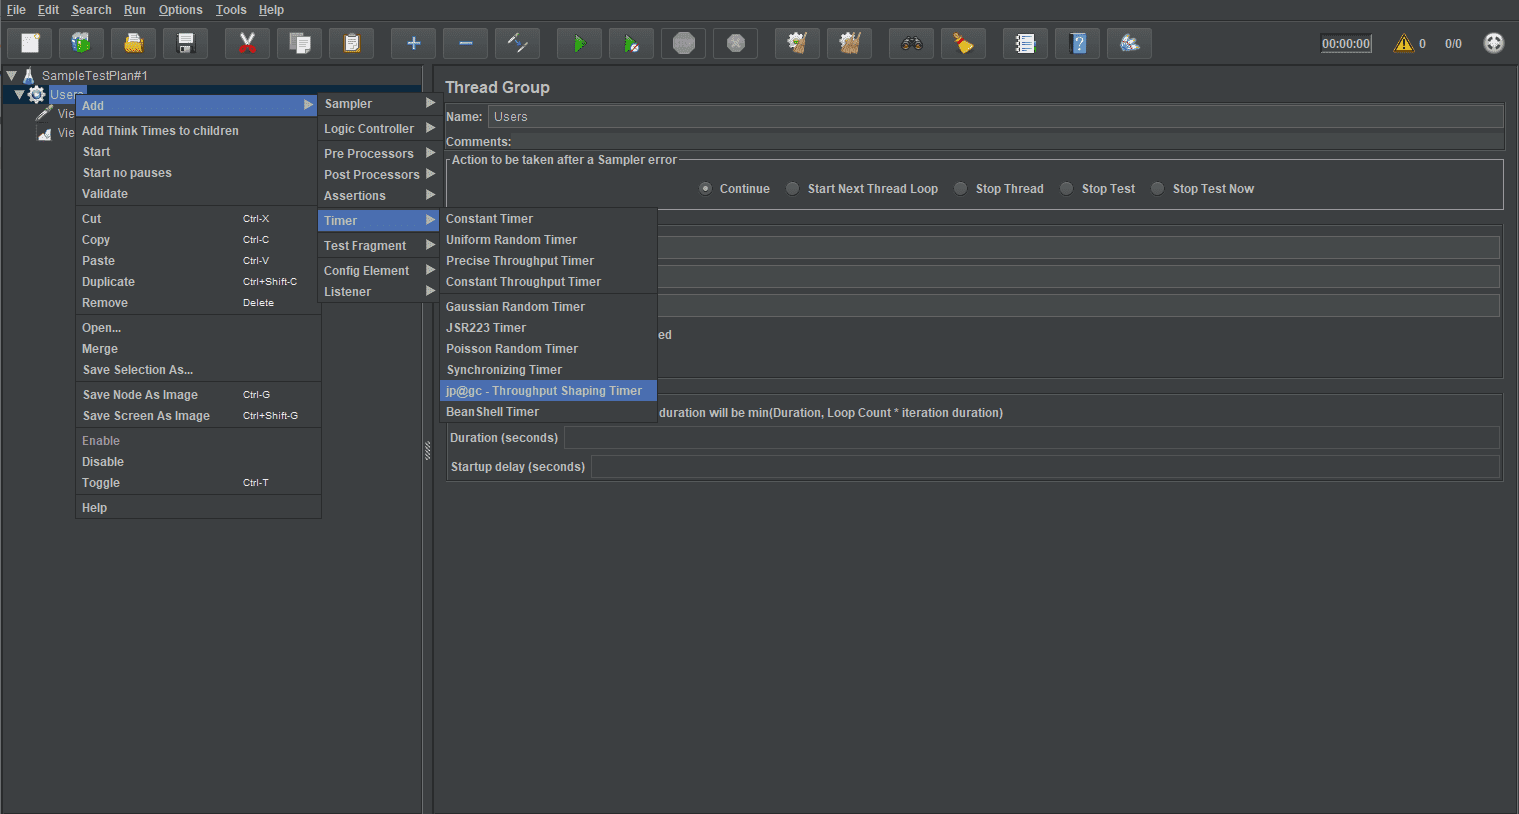
a. Throughput Shaping Timer:
How To Install:
How To Add:
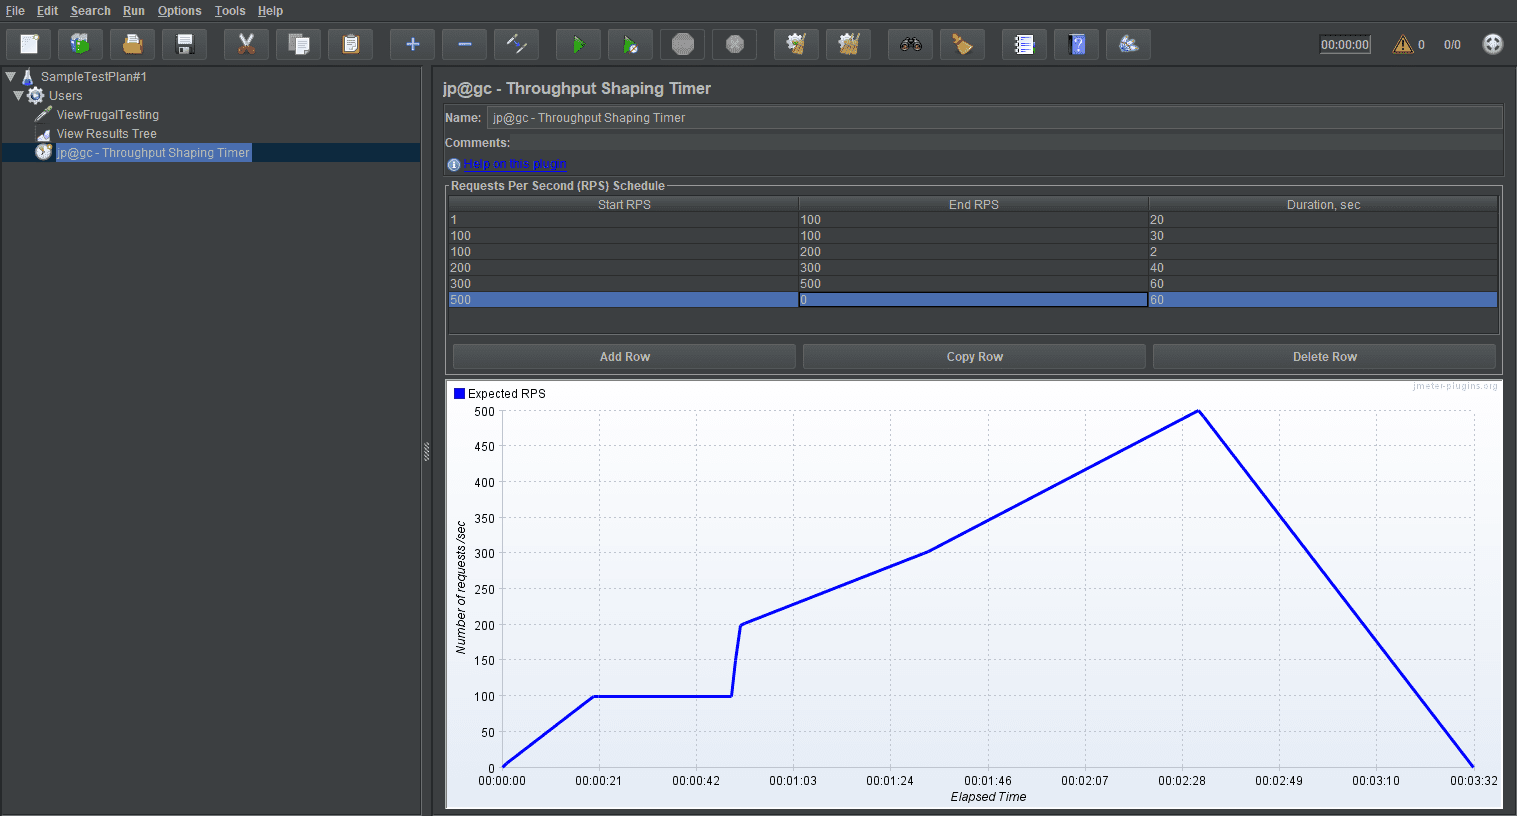
As you can see from the image above, the Timer has a fixed schedule table and a preview graph which makes it easier to control a load during the test run.
b. Special Property Processing:
This feature provides users with the ability to process a JMeter property “load_profile”. This property specifies a load pattern with a set of function-like declarations. These Declarations can be of 3 types:
The main advantage of reading about this property is we can setup requests per second throughput with JMeter.properties file or we can setup requests per second with the command line while running the JMeter.
Example: load_profile=const(30,20s) line(30,100,1m)step(5,20,5,5m)
c. Schedule Feedback Function:
This function enables a feedback loop for the number of threads. The job of the feedback loop is to see if enough number of threads are running at any time. It also provides additional threads if the criteria are not met i.e. if requests per the second schedule are not achieved during test runs.
Example: ${tstFeedback(ThroughputShaping(1,500,50)}
Here, Throughput_Shaping is the Throughput Shaping Timer to integrate with. 1 is the number of starting threads. 500 is the number of max threads allowed. 50 is the number of spare threads to be kept in the thread pool. So, this function will be able to increase the number of threads up to 500 in case the request per the second schedule not met during the test run.
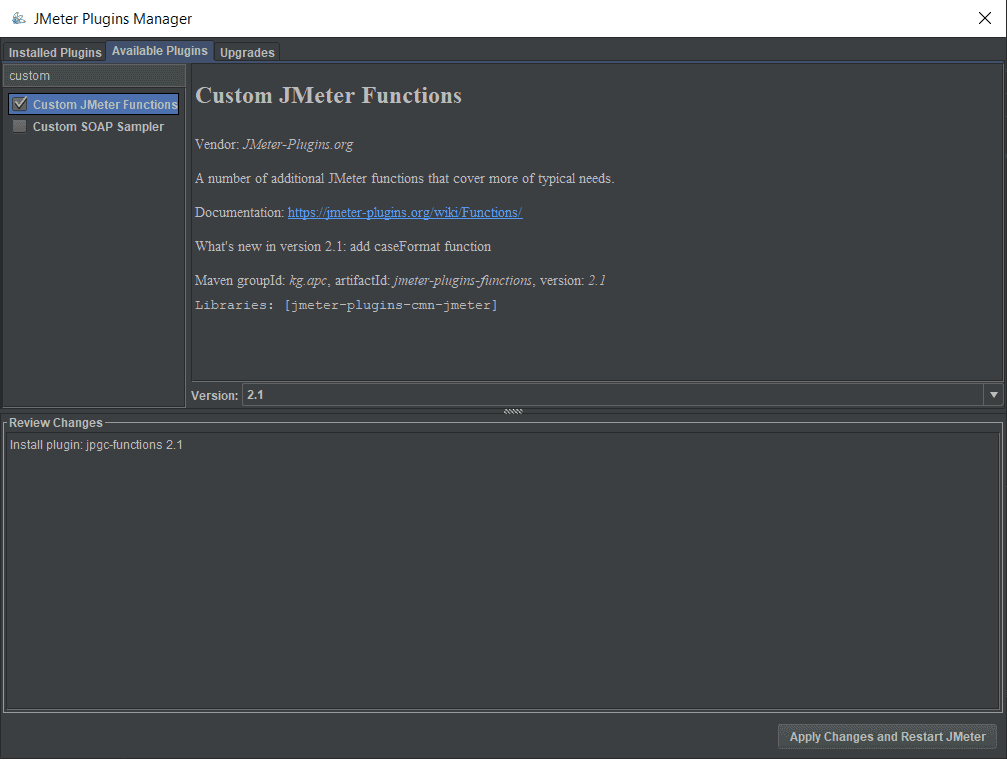
7. Custom JMeter Functions
This plugin extends JMeter functionality with a number of functions:
How To Install:
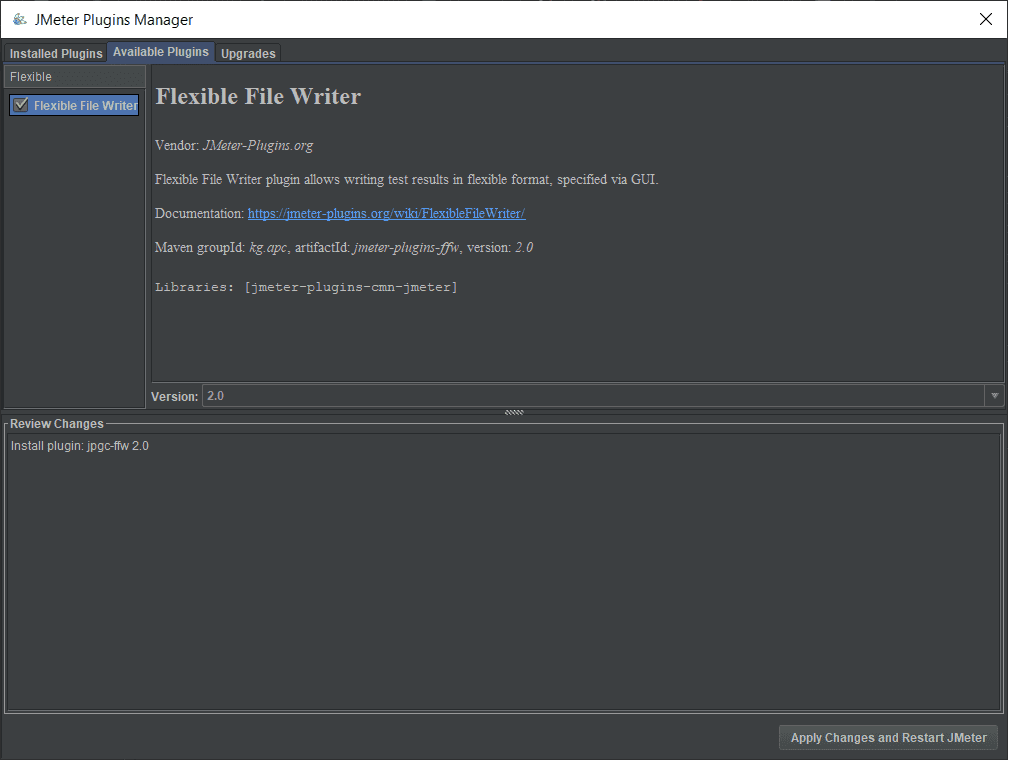
8. Flexible File Writer
This plugin extends JMeter with a Listener “Flexible File Writer”. This listener enables us to write JMeter test results to a file in a flexible format, which can be specified via JMeter GUI.
How To Install:
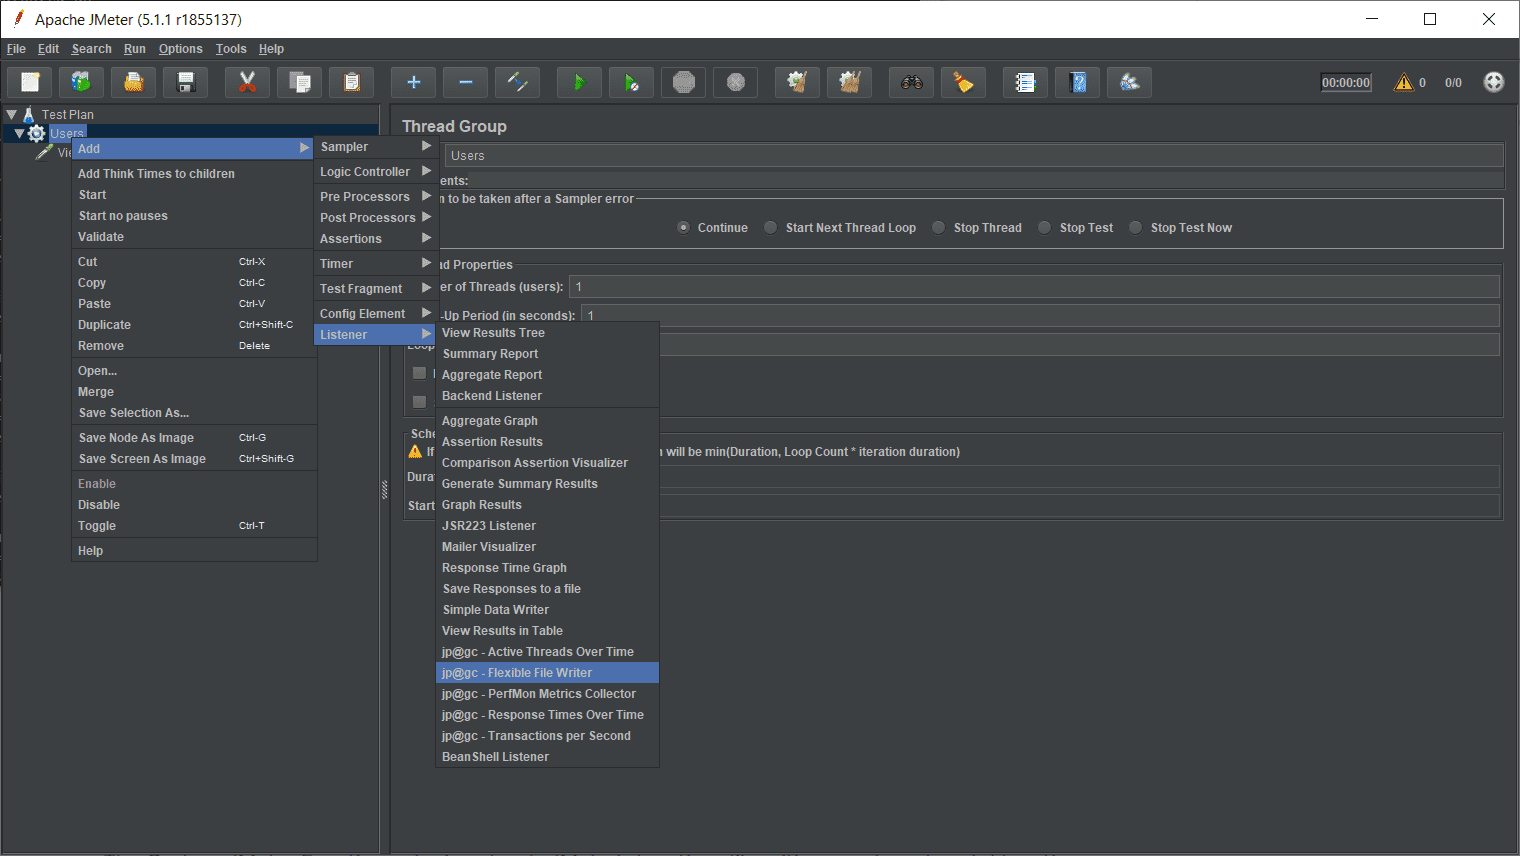
How To Add:
Example:
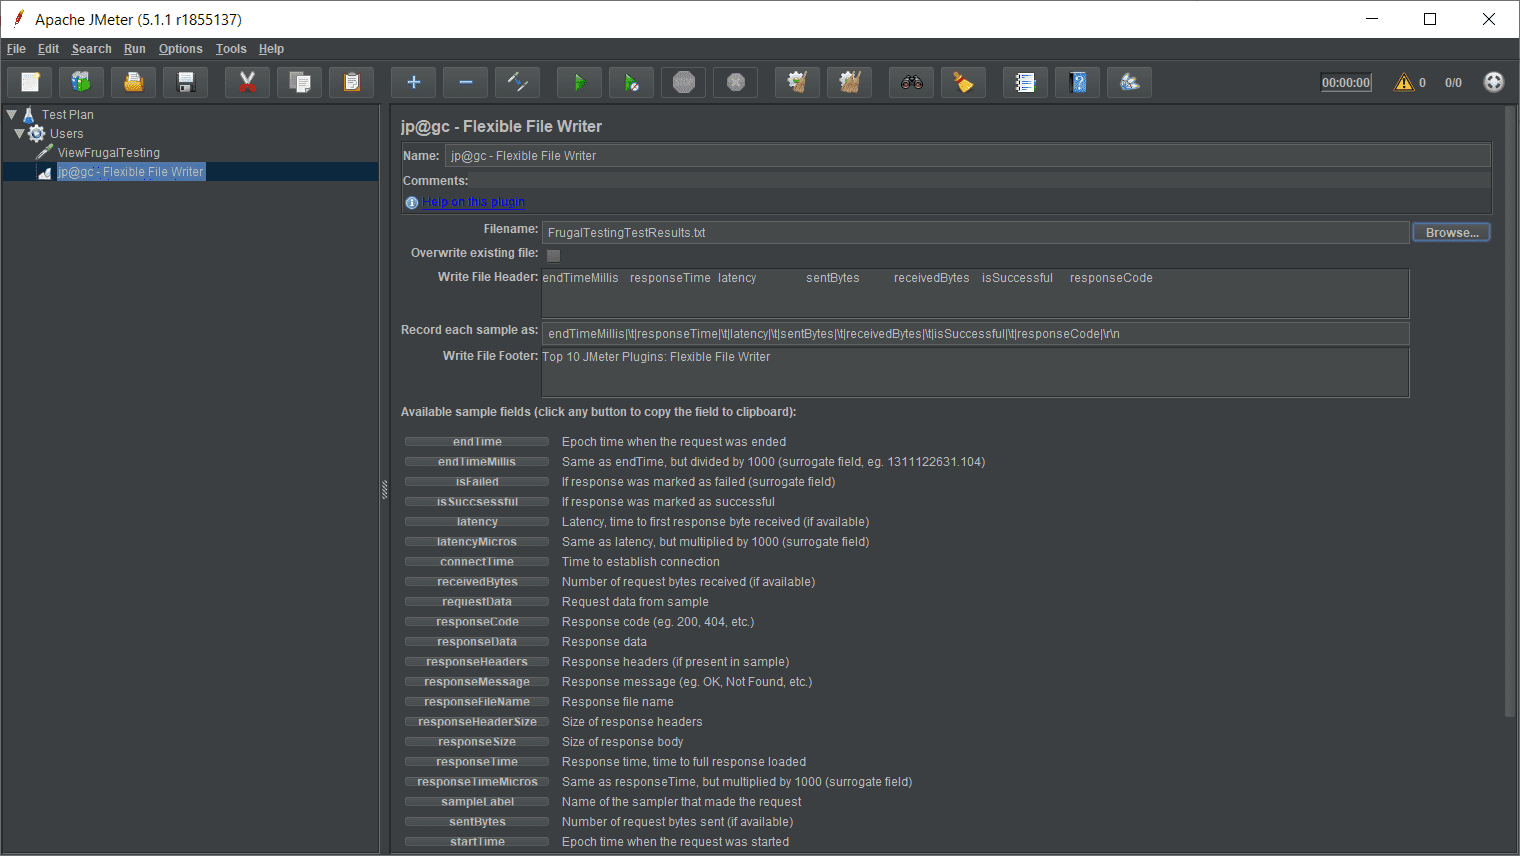
The Listener provides some options to configure the output file. By using those options we can change file header, file footer and log content. For example, I have changed the File footer to “Top 10 JMeter Plugins: Flexible File Writer.”
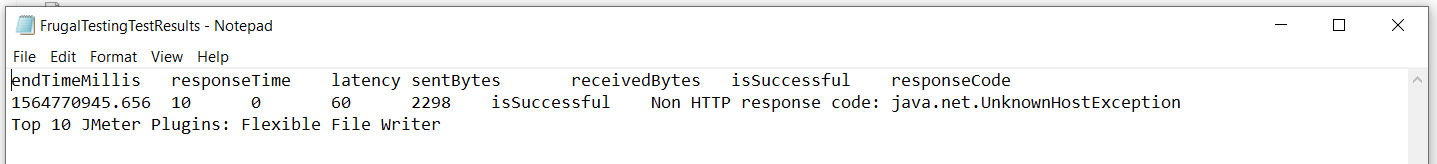
By default, the log contains the following values for each sample run: endTimeMillis, response time, latency, is filed, successful, latency micro, etc. An example of the output file content can be seen below:
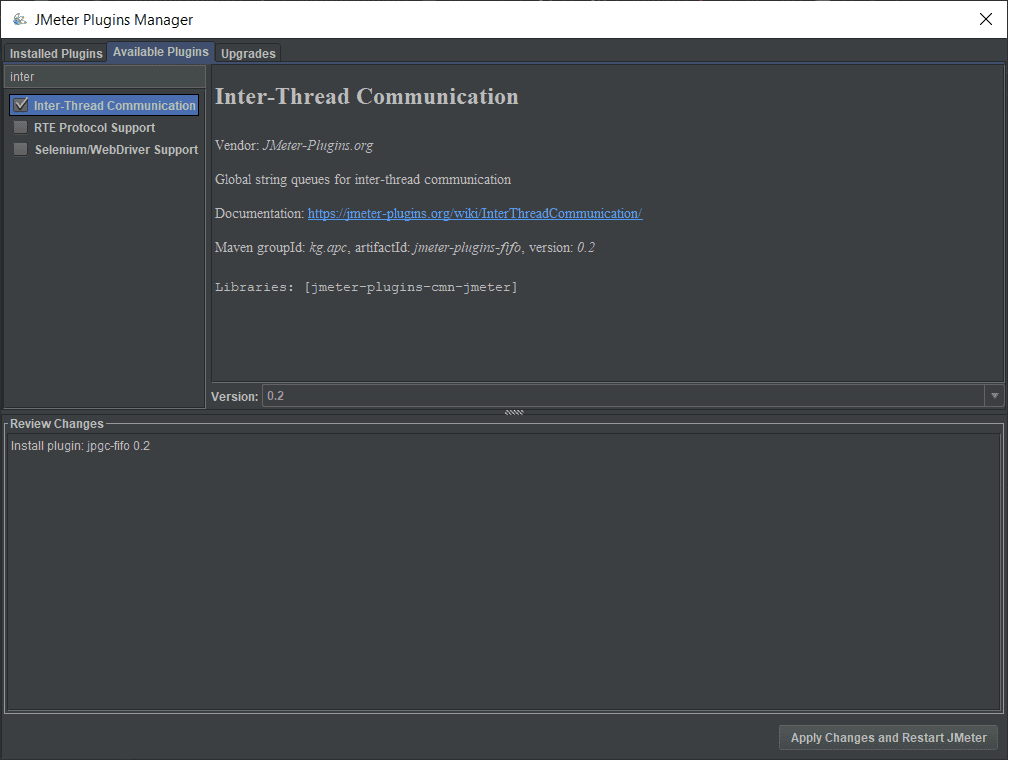
9. Inter-Thread Communication
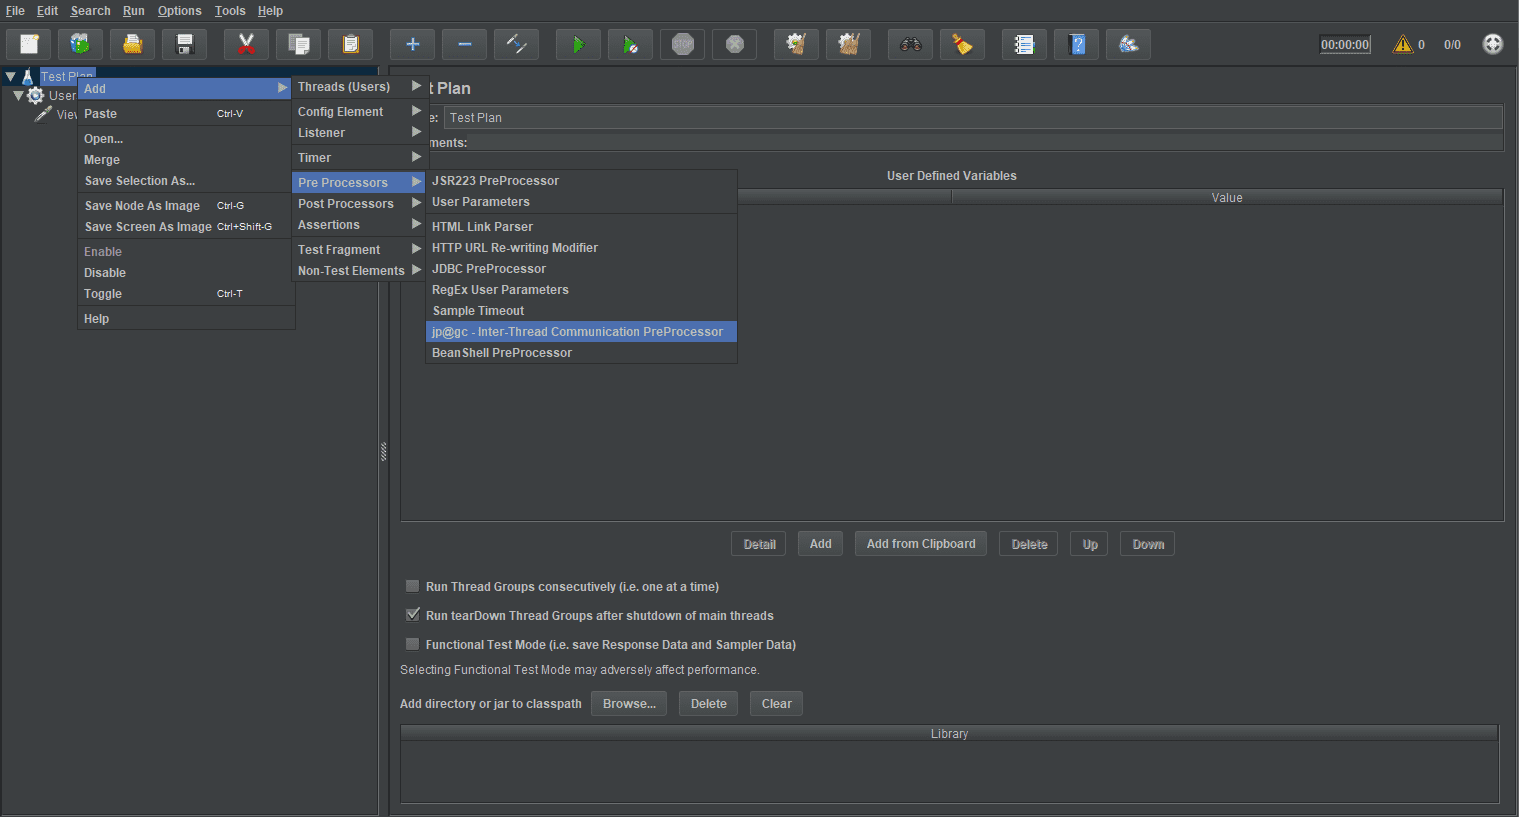
Inter-Thread Communication post-processor, Inter-Thread Communication preprocessor, and a number of functions. Inter-Thread Communication helps us to synchronize various thread groups. In this method, a string value is put into a queue from one thread group and then get that value into another thread group.
How To Install:
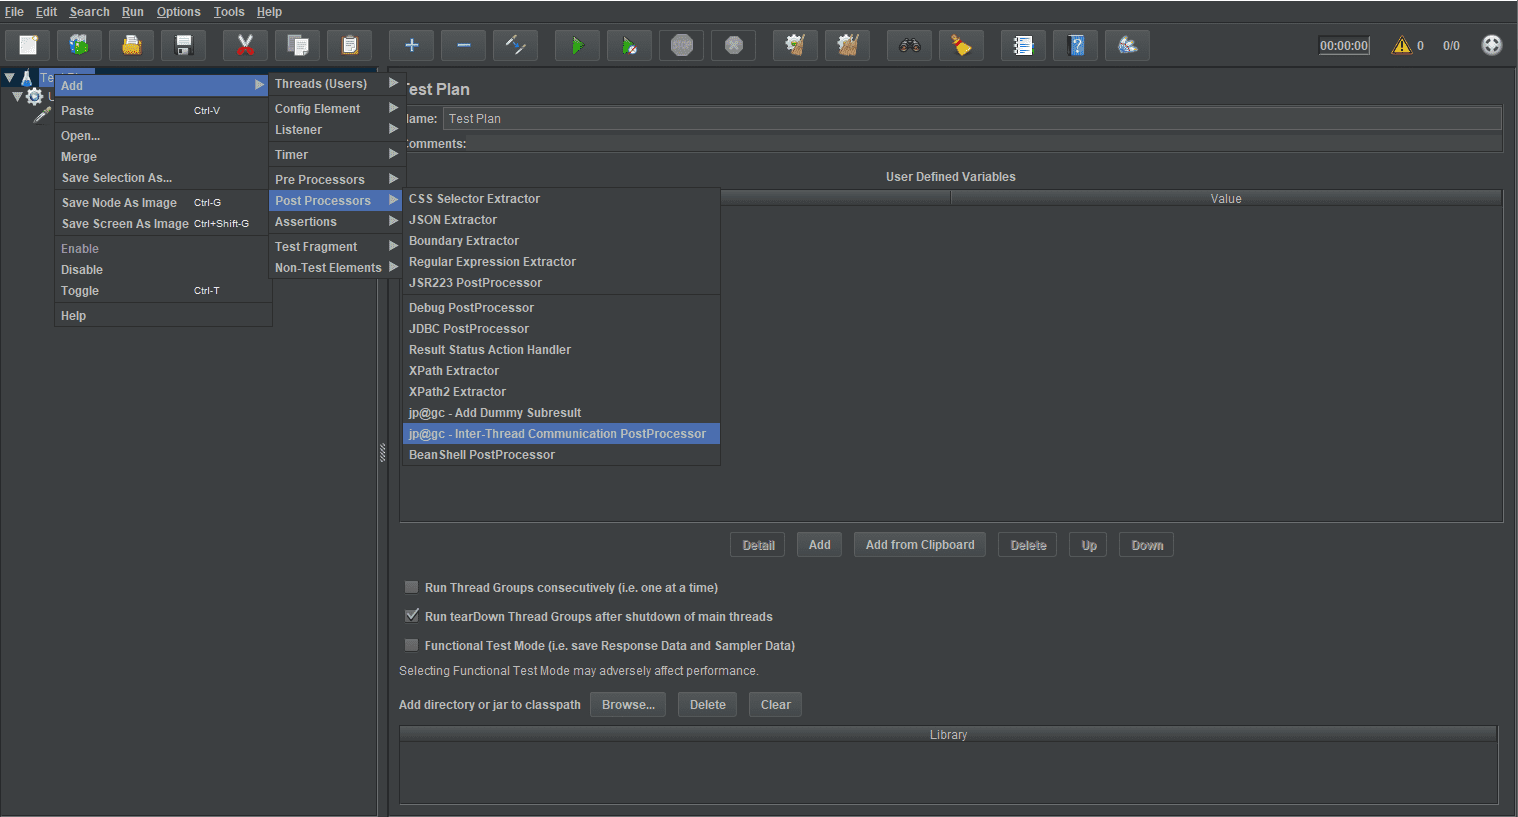
How To Add:
Right Click on the Test Plan→Add→Post Processors→jp@gc-Inter-Thread Communication PostProcessor
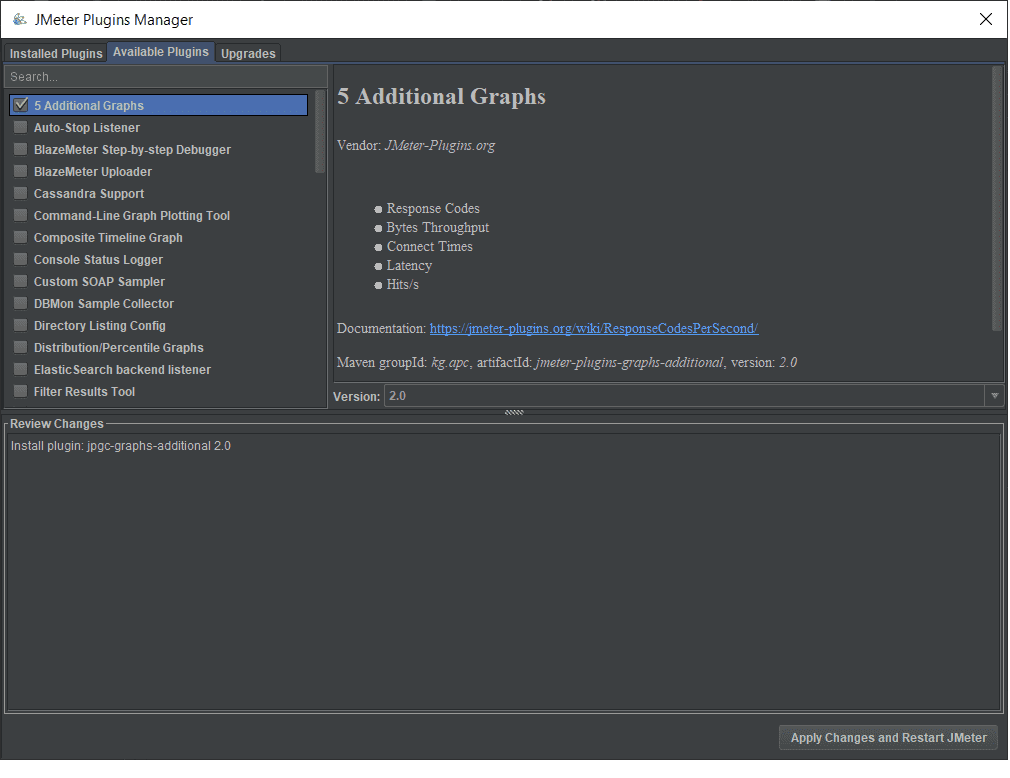
10. 5 Additional Graphs
This plugin provides 5 different types of Graphs.
How To Install:
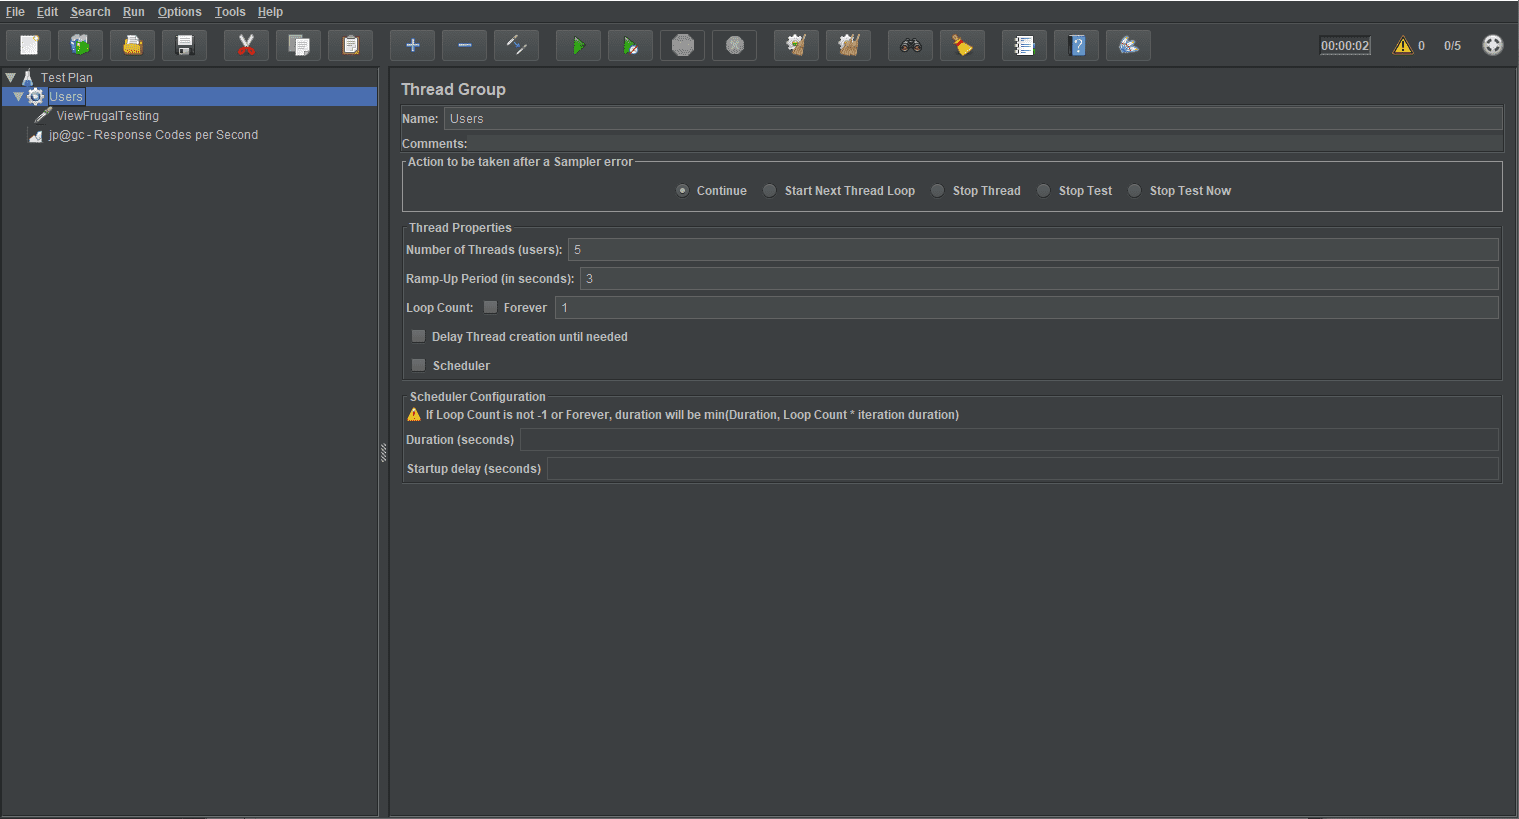
For all the examples we will consider below Thread Group settings and with Sampler HTTP Request having Server IP: www.frugaltesting.com.
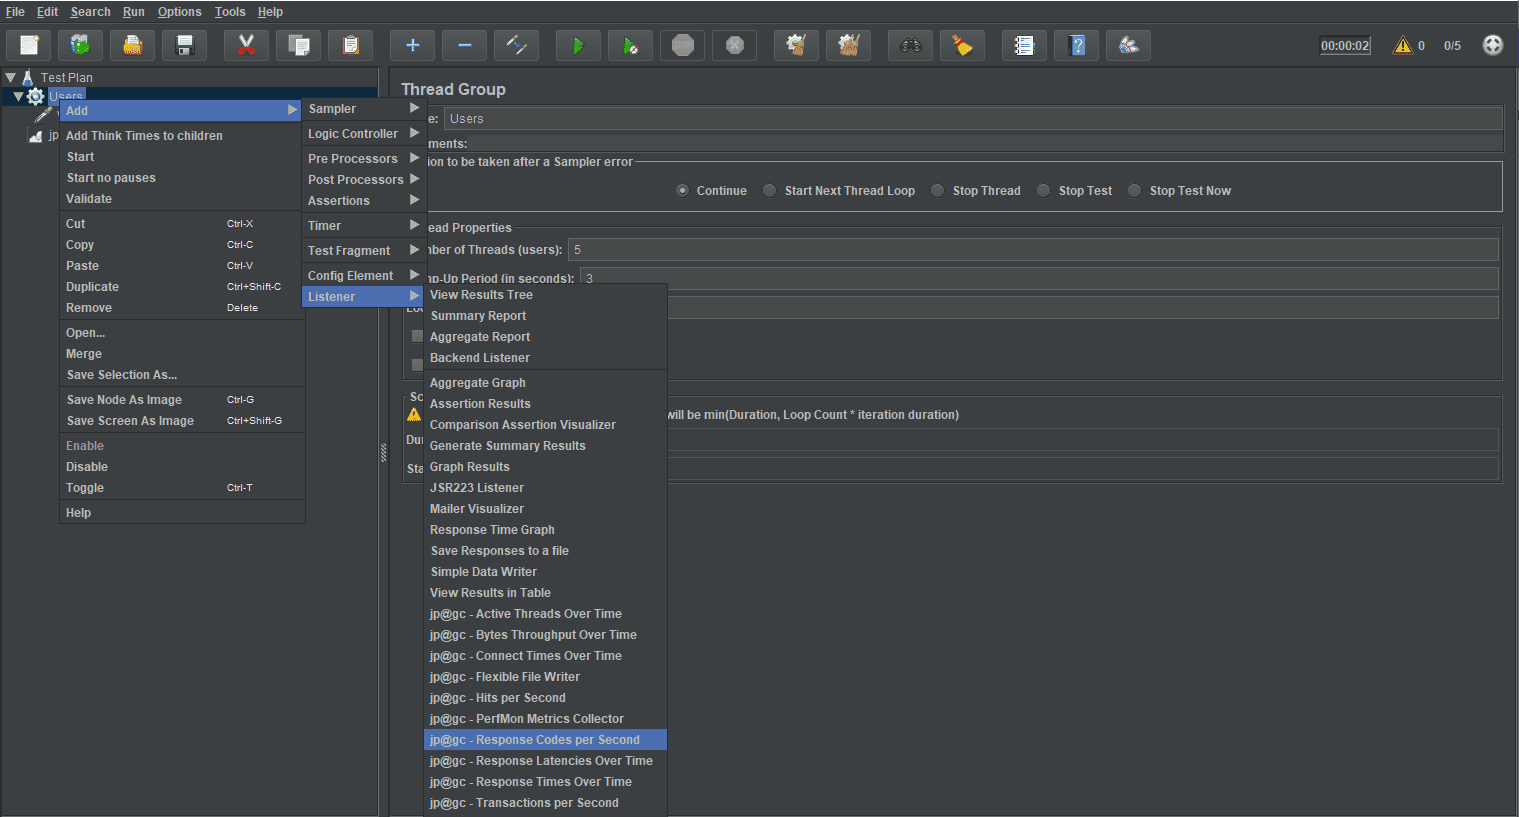
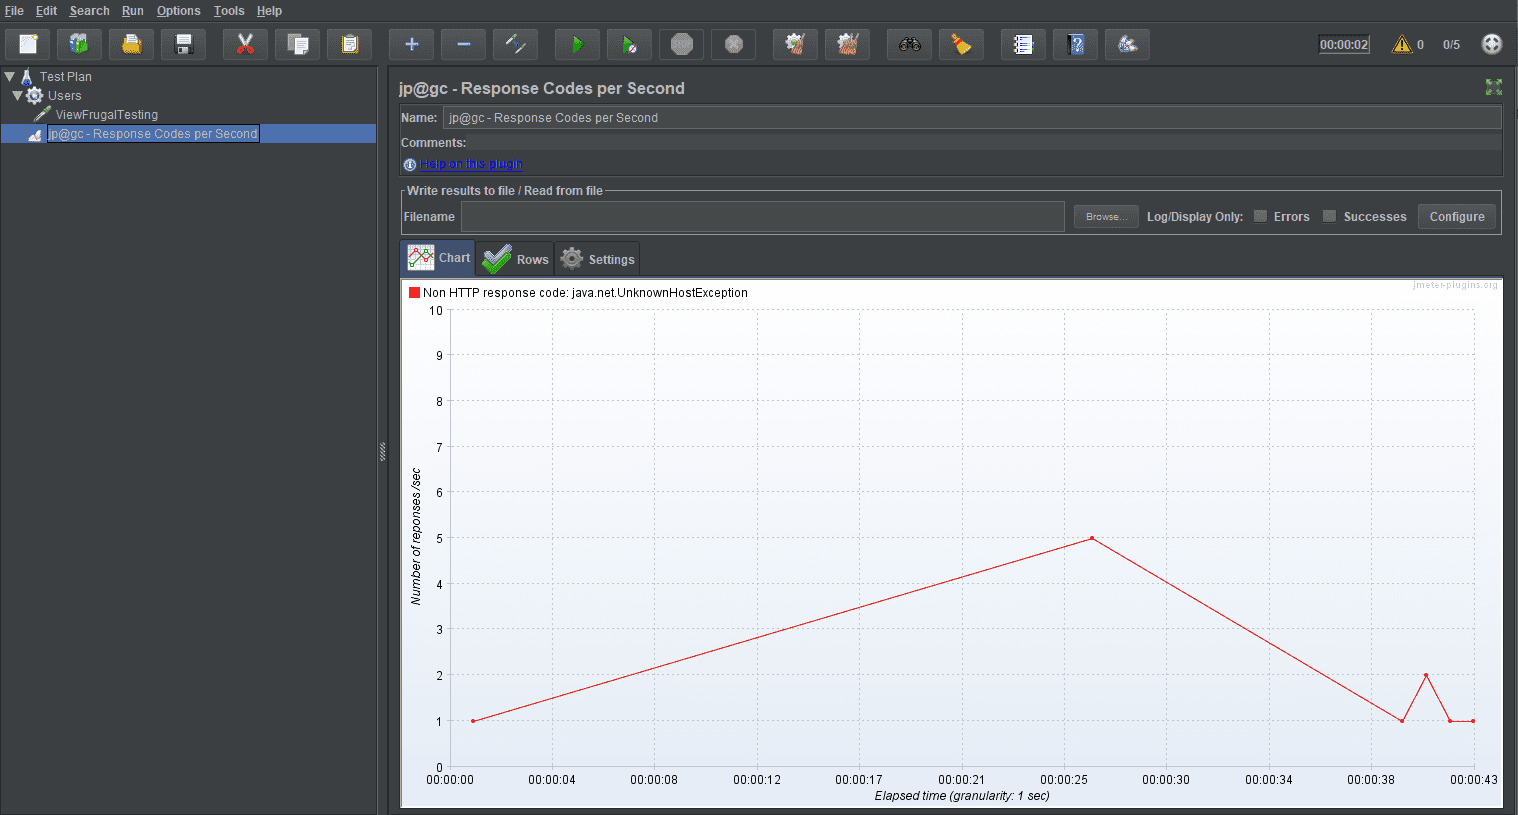
a. Response Code Graph:
How To Add:
Example: Below Graph shows the result in accordance with the Thread Group Scenario and Sampler discussed above.
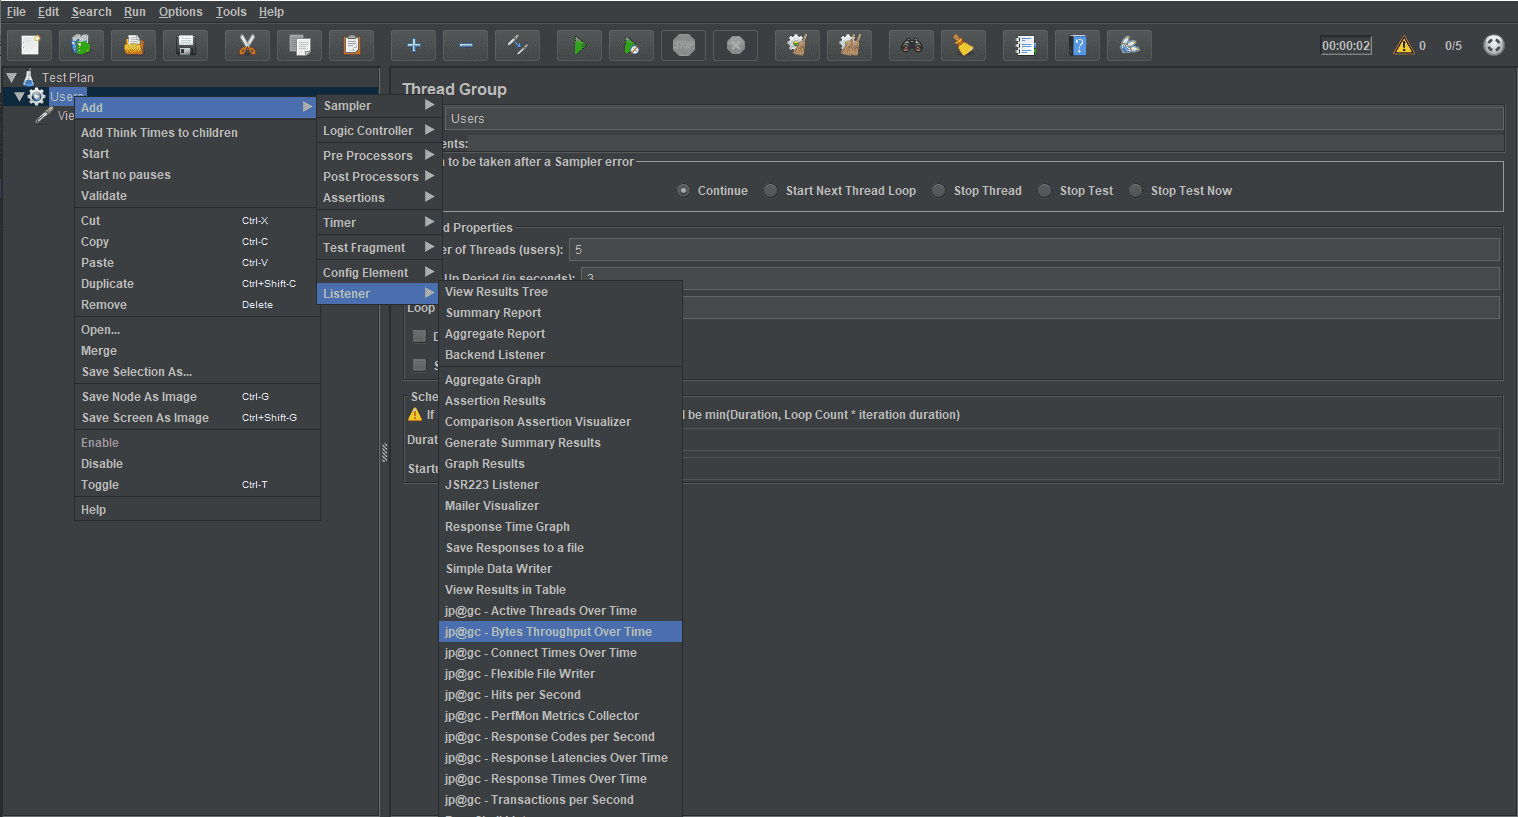
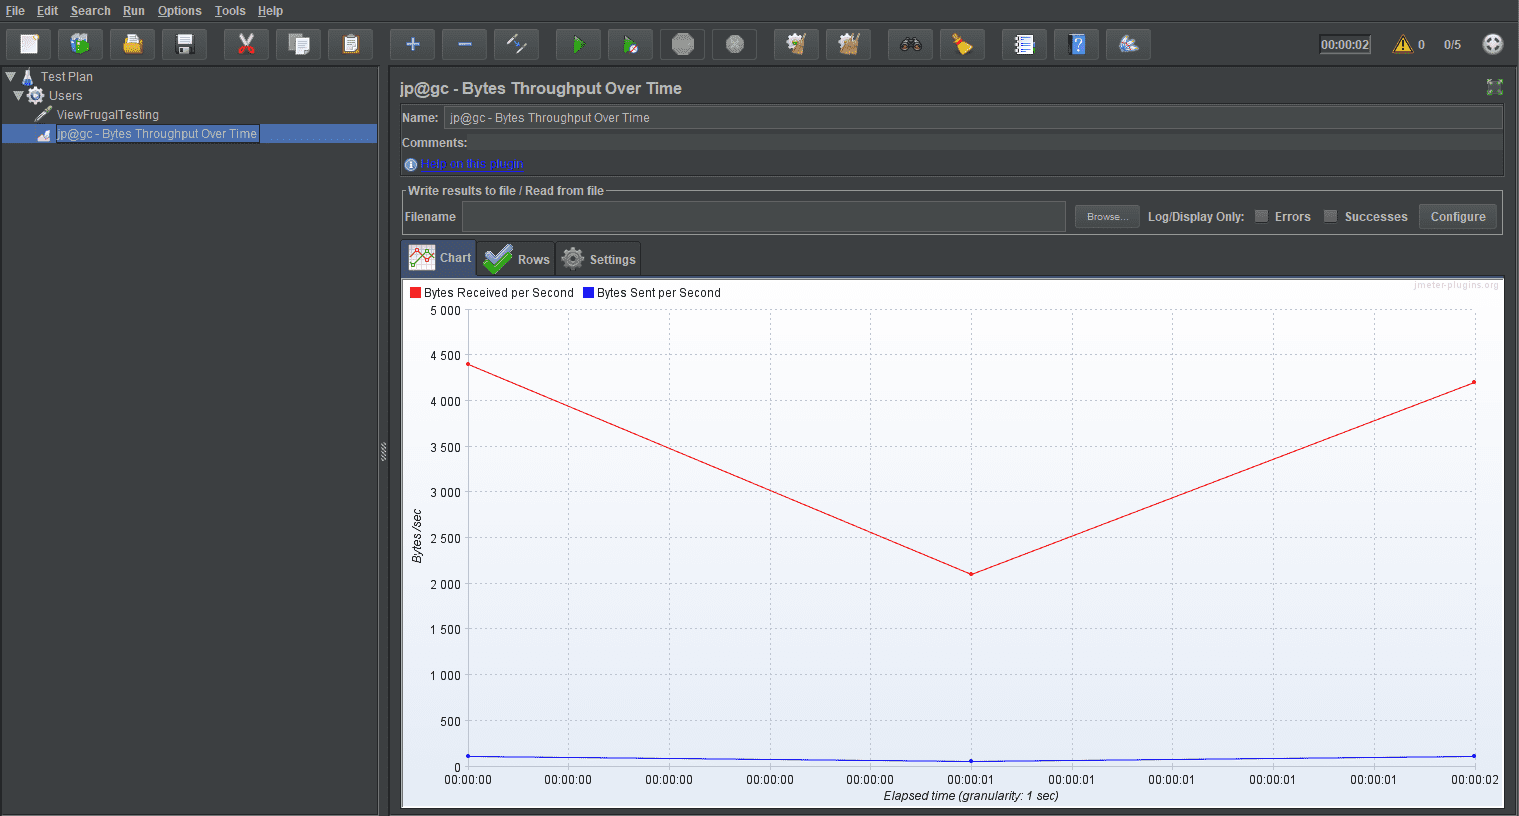
b. Bytes Throughput:
How To Add:
Example: Sample runs for the same Thread Group and Sampler.
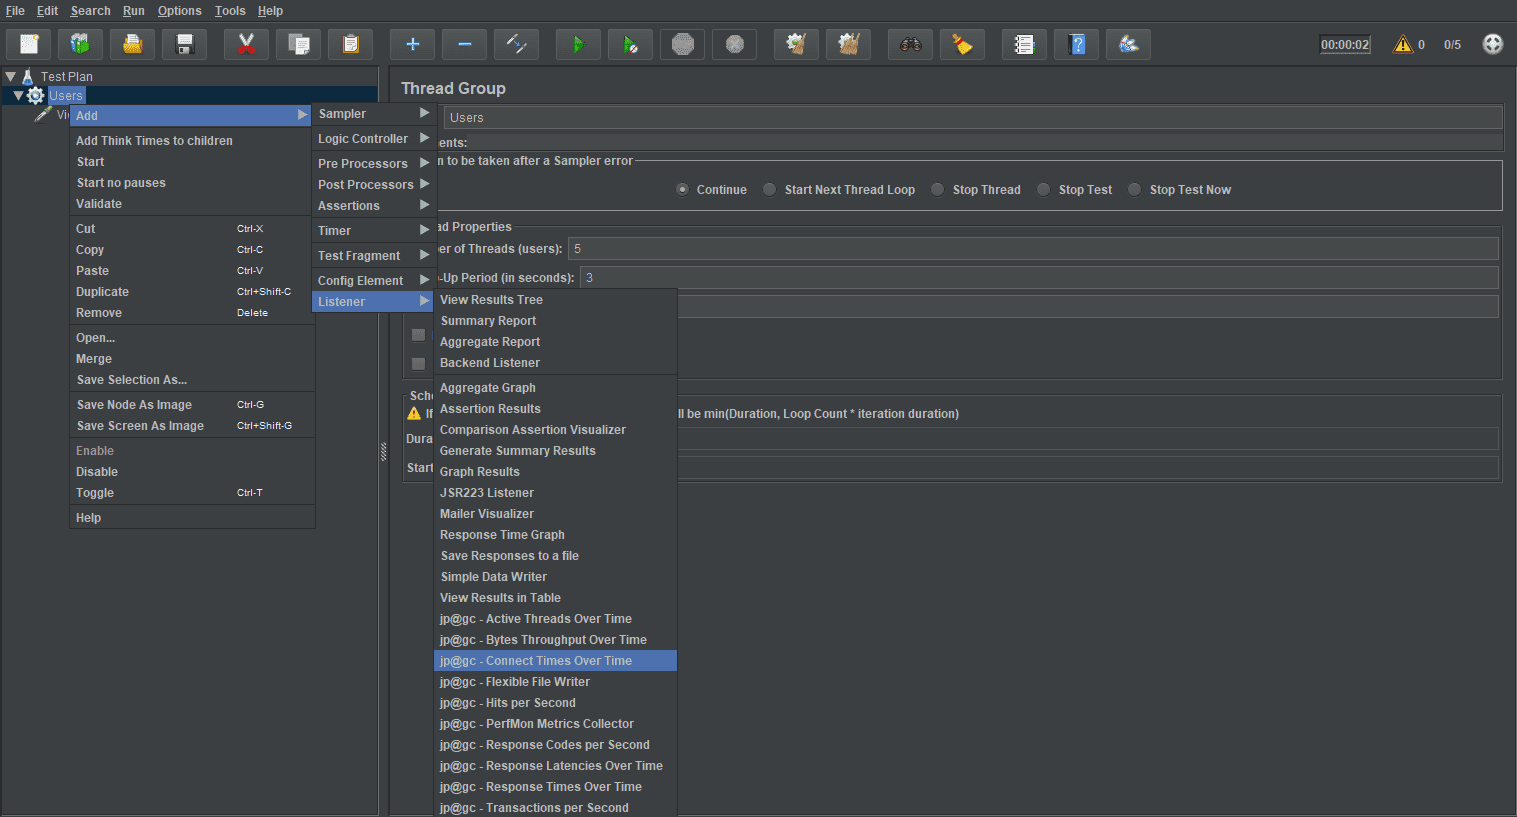
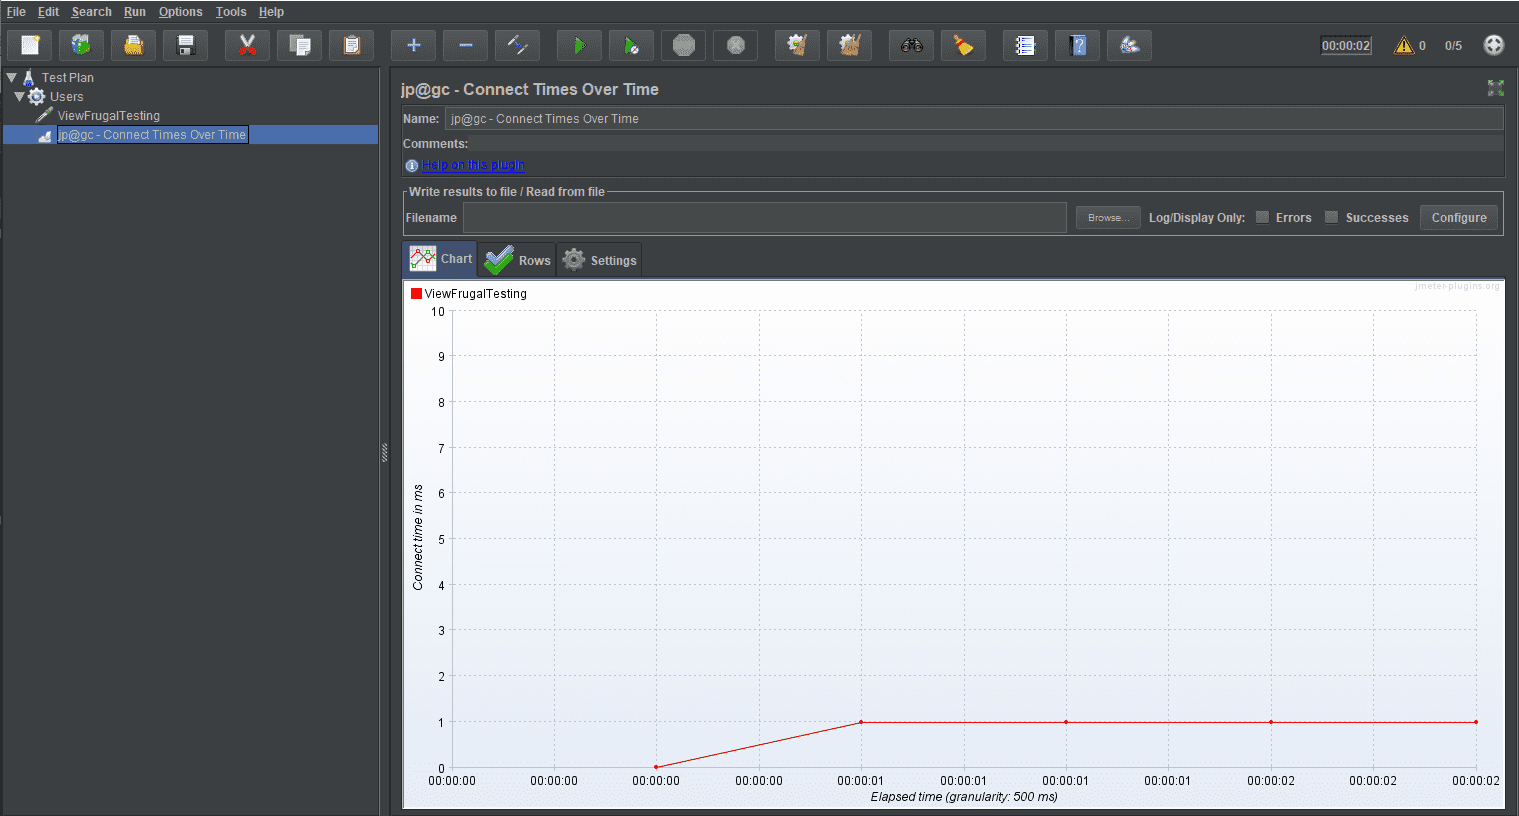
c. Connect Times:
How To Add:
Example:
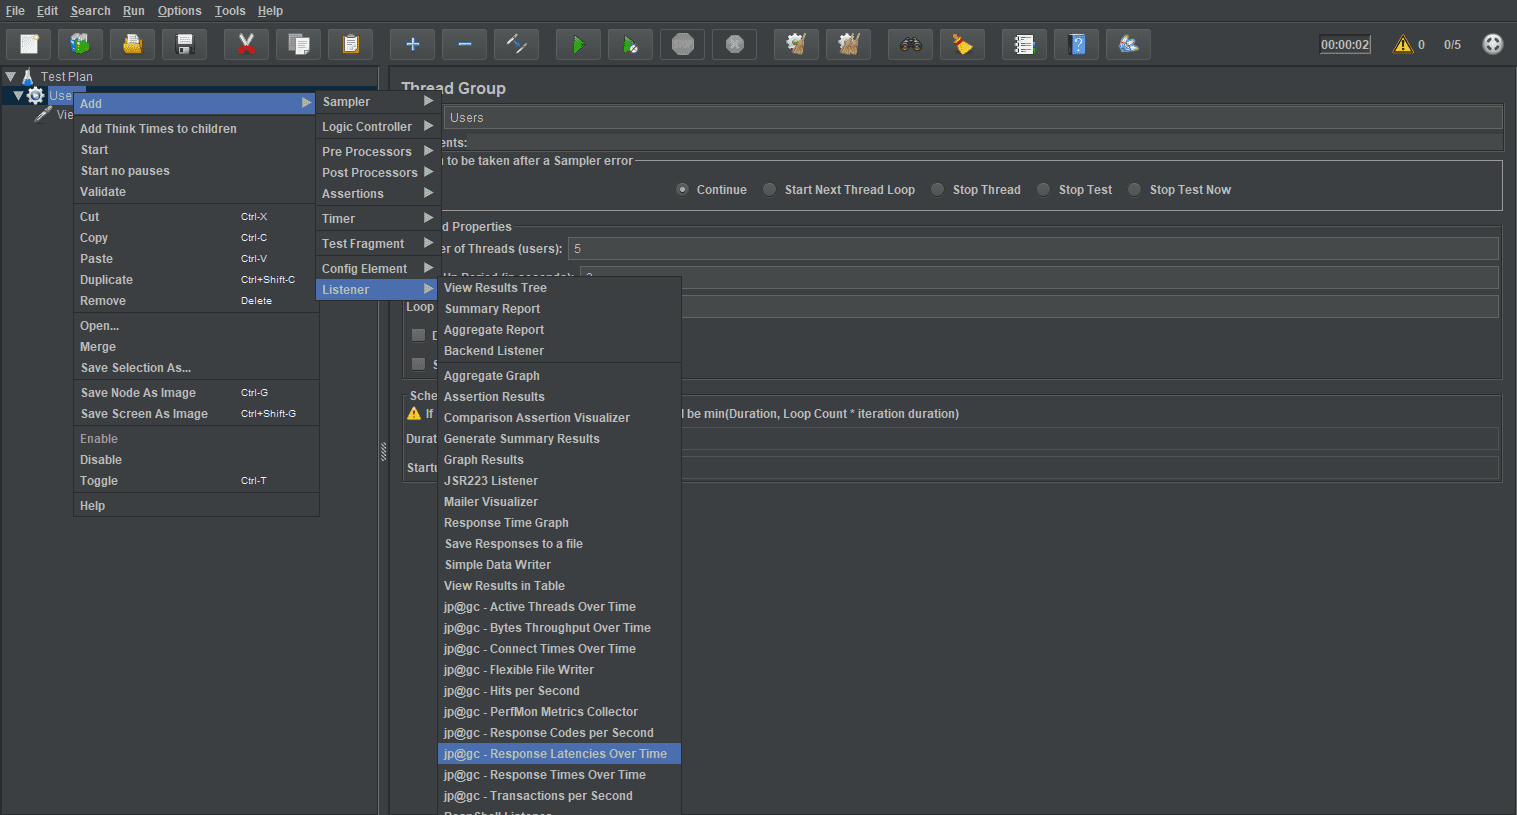
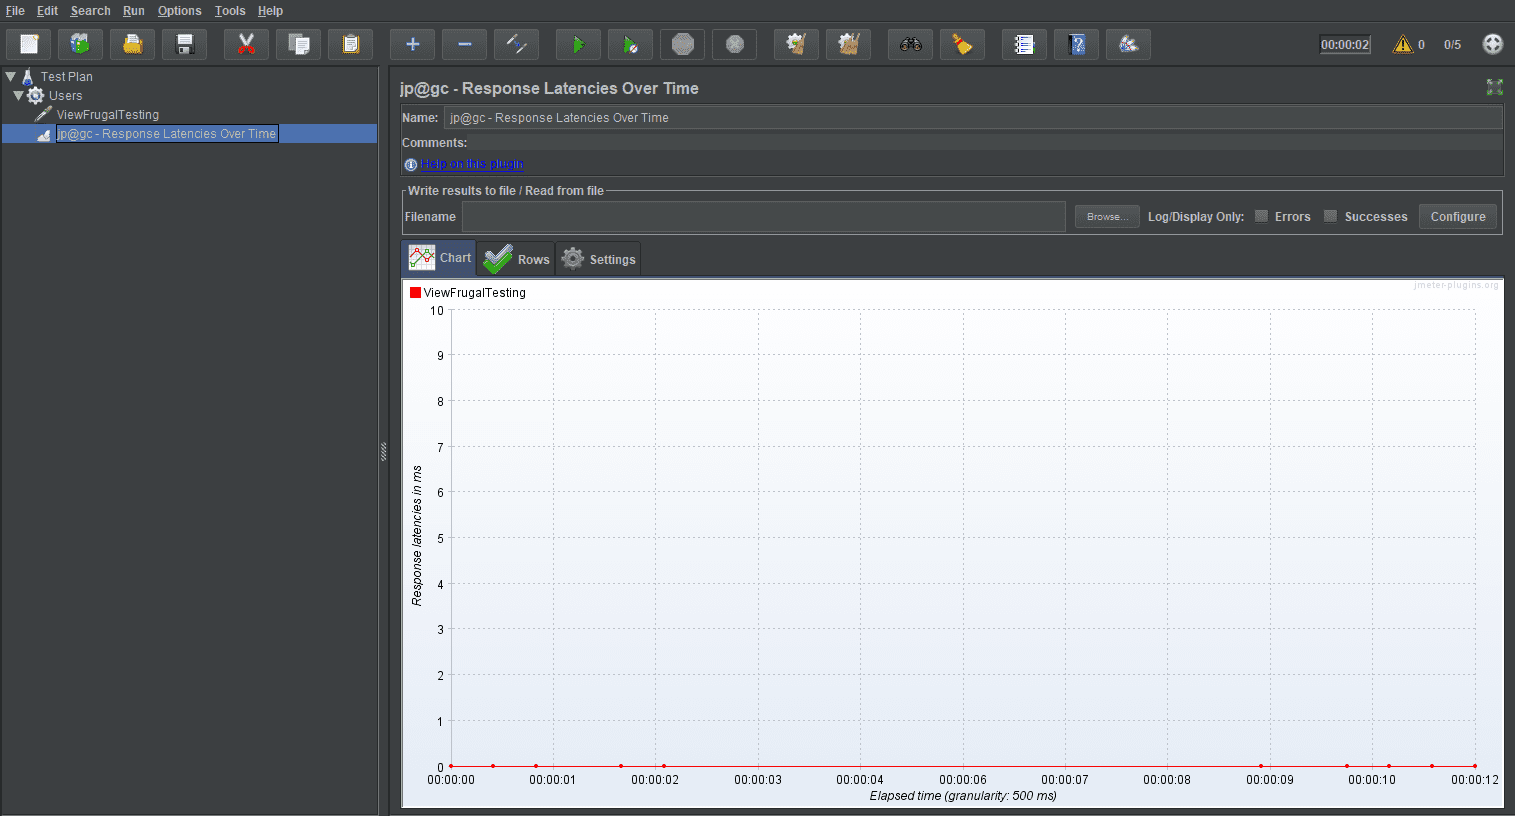
d. Latency:
How To Add:
Example:
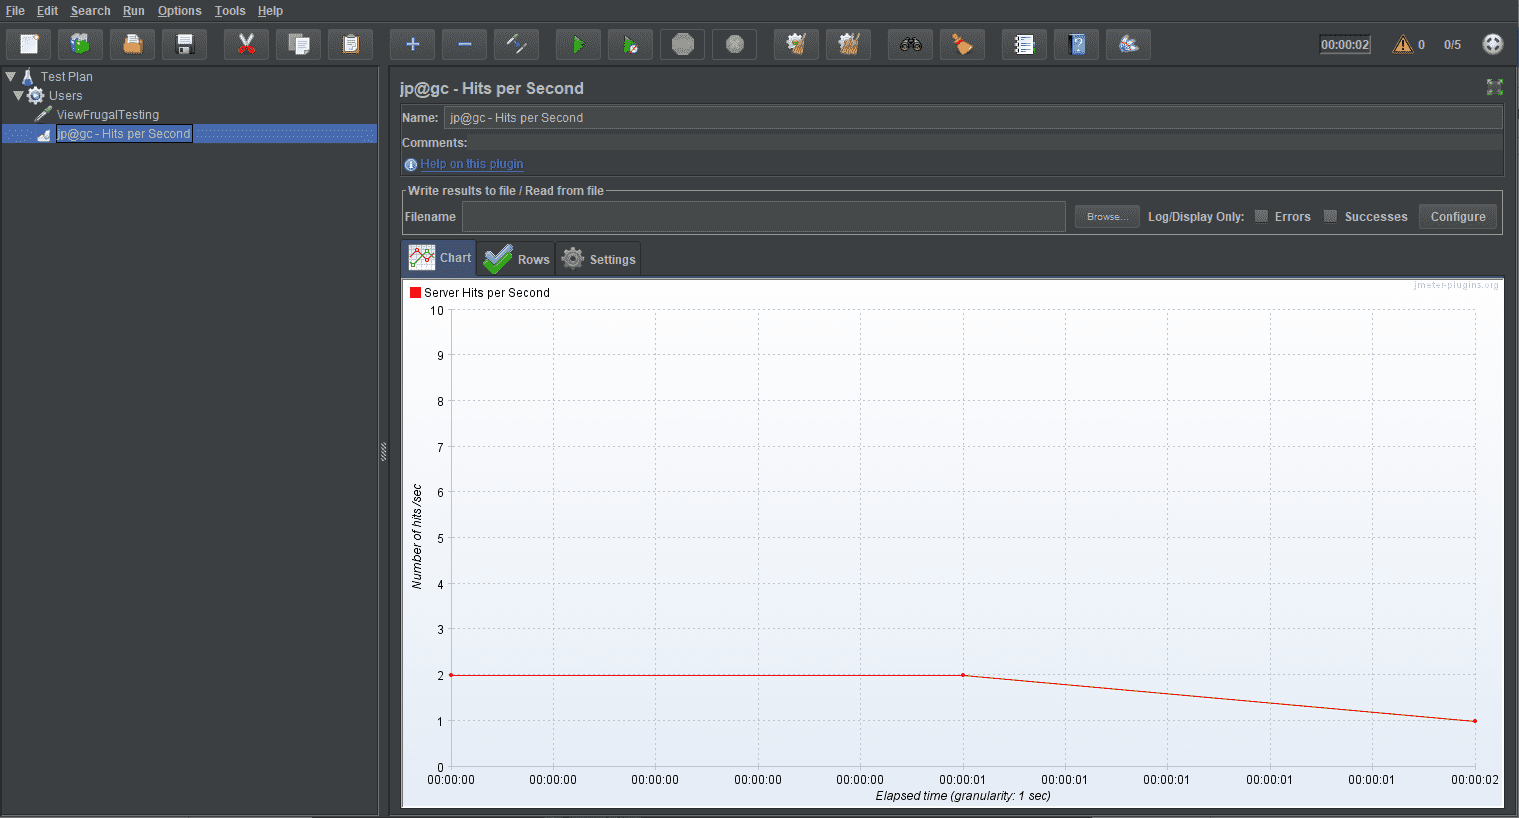
e. Hits/s:
How To Add:
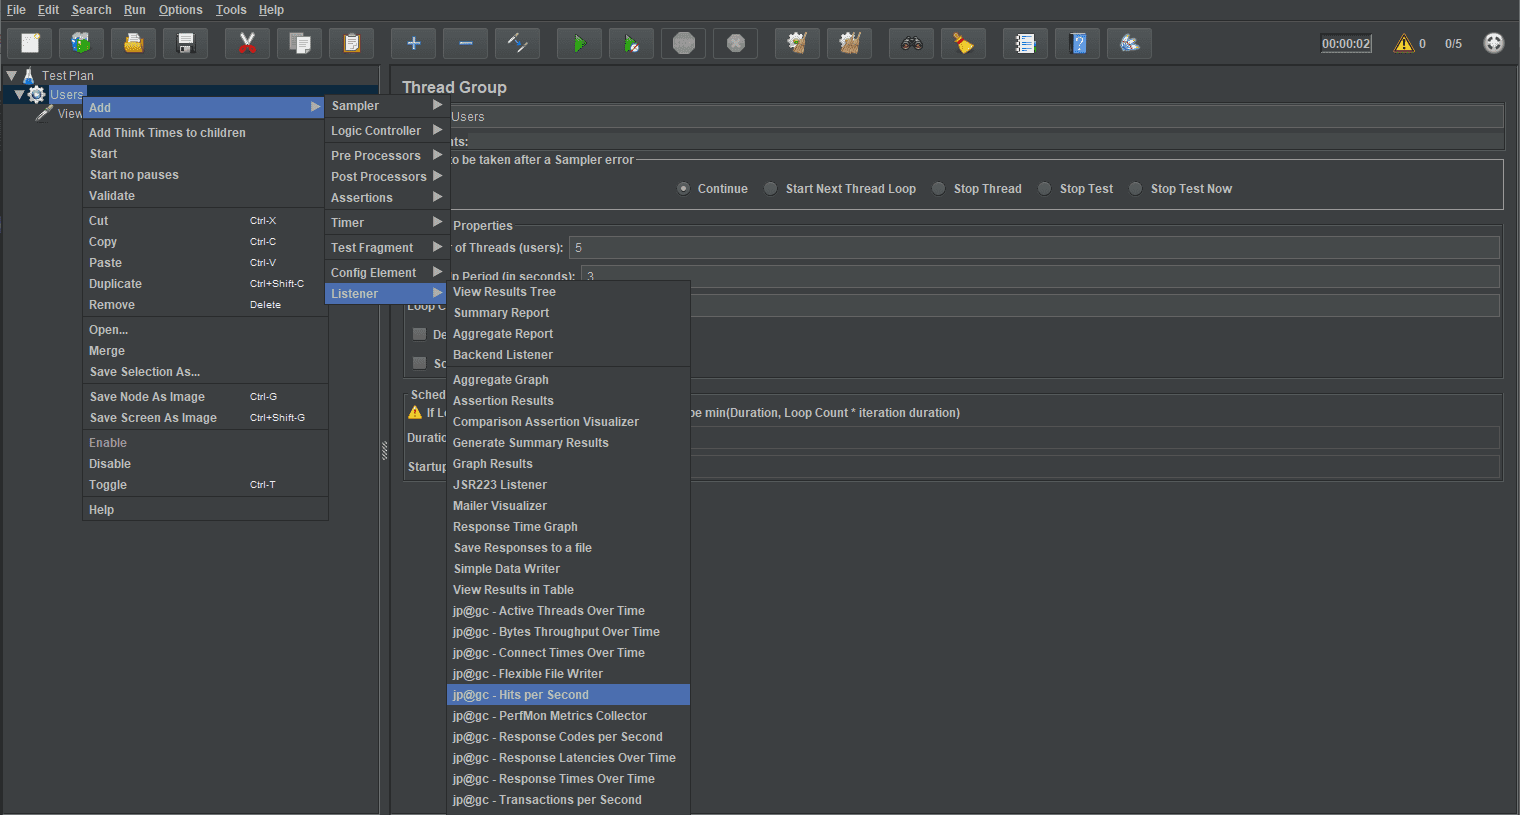
Example:
With this, we have completed all the Top 10 Plugins of JMeter. Now it’s your turn to get started and try these plugins on a Test Plan.
2020 / 2 / 27
2020 / 2 / 27
2020 / 2 / 27
2020 / 2 / 27
2020 / 2 / 27


JMeter - How to record Mobile Application traffic?